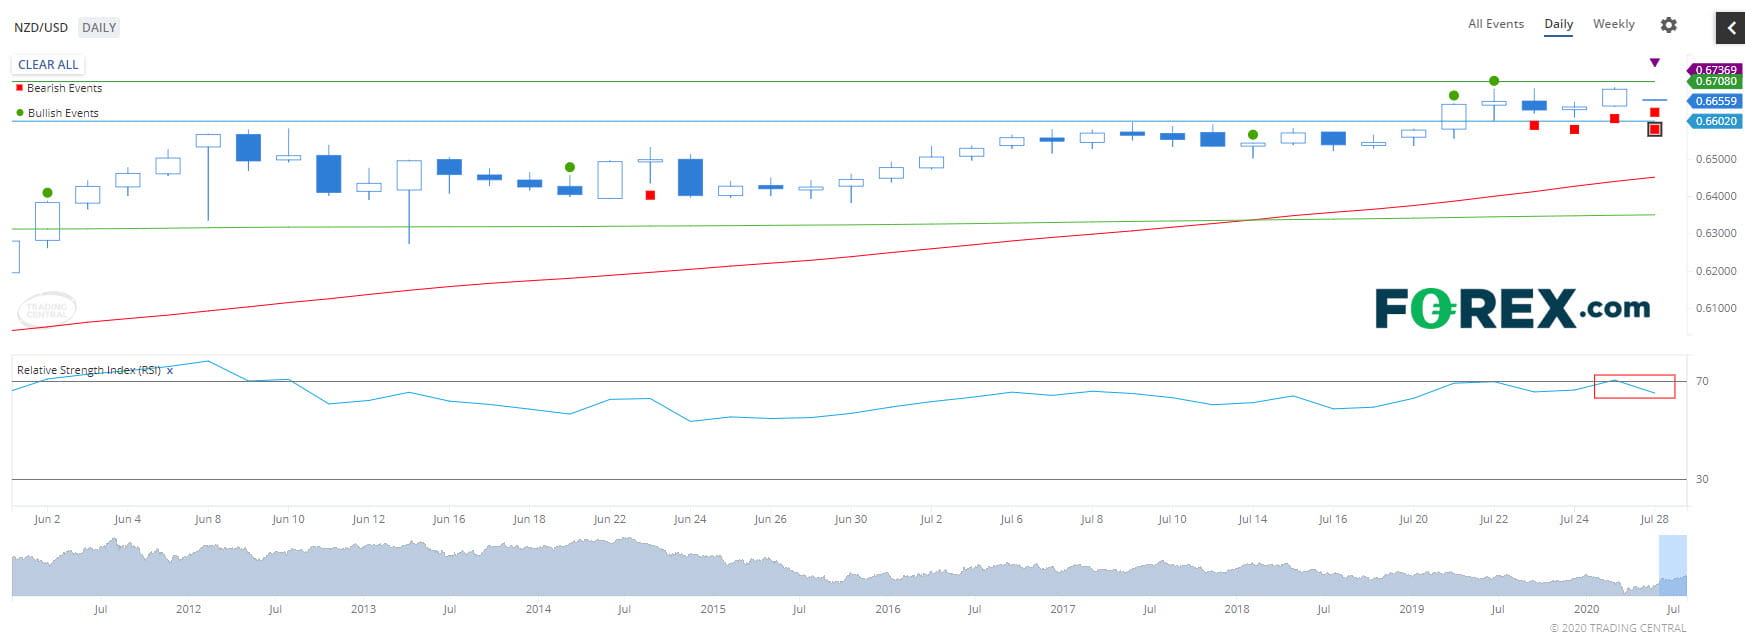
Using the "Technical Insight" research tool under the Market Analysis tab, we have identified two bearish technical events.
The NZD/USD has confirmed an Inside Bar candlestick pattern and an RSI overbought reading.

Source: GAIN Capital, Technical Insight
An Inside Bar develops during a strong uptrend when the trading range is completely within the boundaries of the prior bar. This suggests the balance between buyers and sellers is becoming more evenly balanced i.e. a weakening in power for the bulls and increasing in power for the bears.
A bearish Relative Strength (RSI) event has also been identified. Price seems to be recovering from overbought because up days are no longer overwhelming down days to quite the same extent as the indicator dipped below its overbought reading of 70.
The RSI measures the strength of an issue compared to its recent history of price change by comparing "up" periods to "down" periods. It's based on the premise that overbought conditions tend to occur after the market has advanced for a disproportionate number of periods. The RSI fluctuates between 0 and 100 with 70 and 30 often used to indicate overbought and oversold levels, and 50 the dividing line indicating the direction of the trend.
Traders looking to short the NZD/USD may want to consider a stop at the 0.6737 level based on the pairs current volatility.
Happy Trading.
The NZD/USD has confirmed an Inside Bar candlestick pattern and an RSI overbought reading.

Source: GAIN Capital, Technical Insight
An Inside Bar develops during a strong uptrend when the trading range is completely within the boundaries of the prior bar. This suggests the balance between buyers and sellers is becoming more evenly balanced i.e. a weakening in power for the bulls and increasing in power for the bears.
A bearish Relative Strength (RSI) event has also been identified. Price seems to be recovering from overbought because up days are no longer overwhelming down days to quite the same extent as the indicator dipped below its overbought reading of 70.
The RSI measures the strength of an issue compared to its recent history of price change by comparing "up" periods to "down" periods. It's based on the premise that overbought conditions tend to occur after the market has advanced for a disproportionate number of periods. The RSI fluctuates between 0 and 100 with 70 and 30 often used to indicate overbought and oversold levels, and 50 the dividing line indicating the direction of the trend.
Traders looking to short the NZD/USD may want to consider a stop at the 0.6737 level based on the pairs current volatility.
Happy Trading.
市场最新资讯
三月 28, 2023 02:13 上午
十月 28, 2022 04:43 上午
十月 28, 2022 04:43 上午
八月 19, 2022 05:44 上午
七月 26, 2022 03:43 上午
五月 10, 2022 02:22 上午


