The NZD/USD currency pair has had an impressive run since posting lows near the 0.547 level back in March but are we near a short term top?
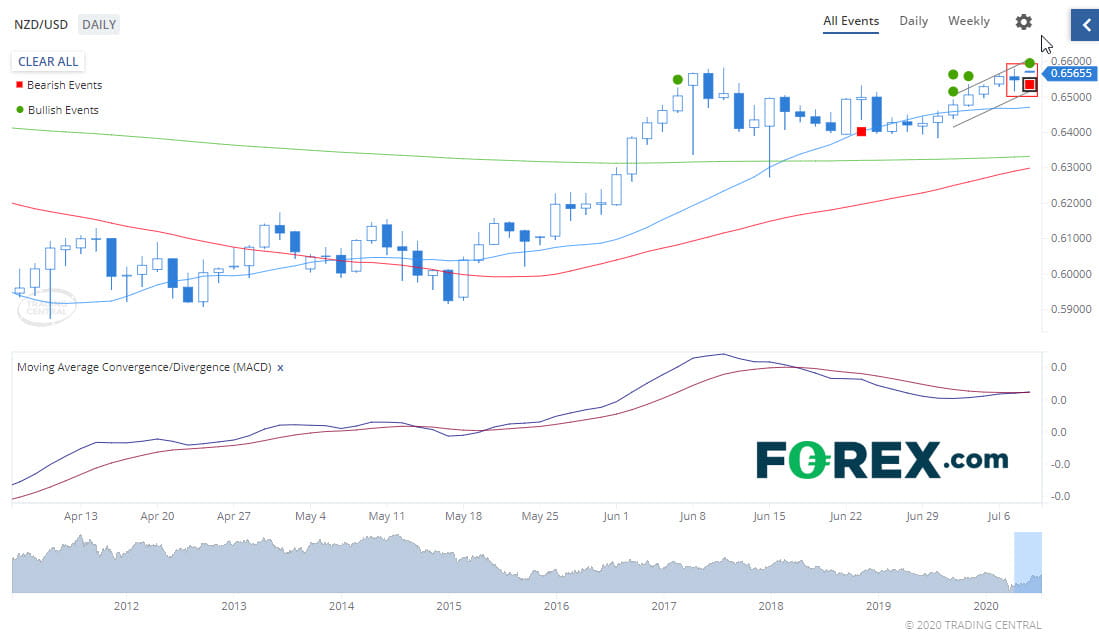
Using the "Technical Insight" research tool under the Market Analysis tab, we have identified a bearish technical event.
The NZD/USD confirmed an Inside Bar candlestick pattern.

Source: GAIN Capital, Technical Insight
An Inside Bar develops during a strong uptrend when the trading range is completely within the boundaries of the prior bar. This suggests the balance between buyers and sellers is becoming more evenly balanced i.e. a weakening in power for the bulls and increasing in power for the bears.
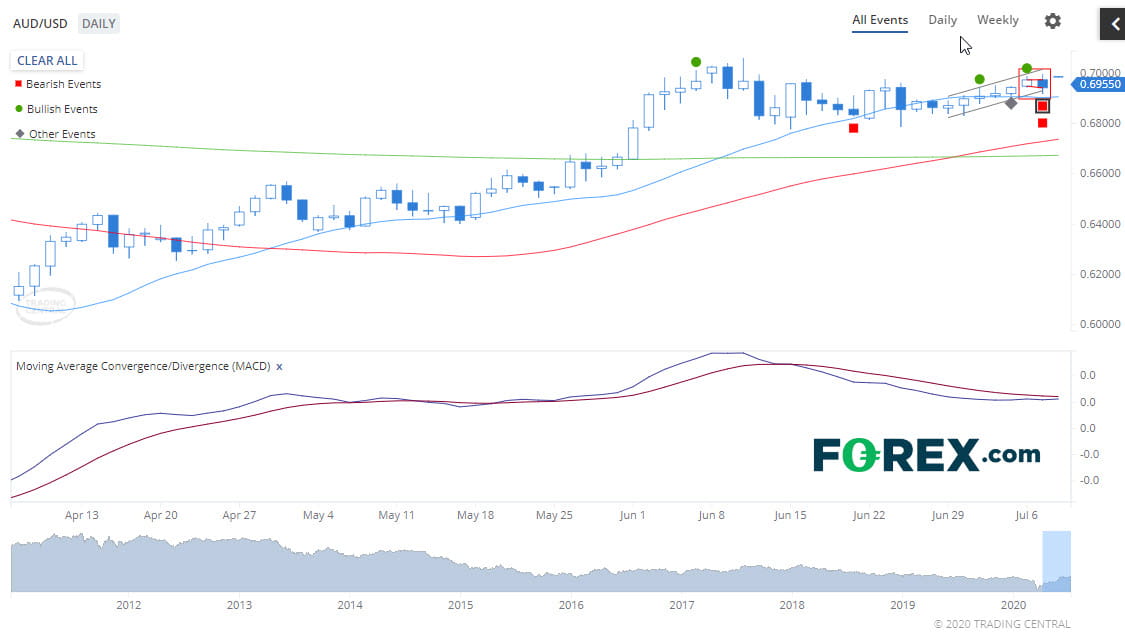
Another bearish candlestick pattern has been confirmed in the AUD/USD which is highly correlated with the NZD/USD.
The AUD/USD confirmed an Engulfing Line candlestick pattern.

Source: GAIN Capital, Technical Insight
Following a clear uptrend, we see two candlesticks where the black real body of the second completely envelops the white real body of the first, showing that the bears have taken over from the bulls.
Although bearish reversal candlestick patterns are no guarantee that the trend will reverse, they are great warning indicators to be kept inside a trader's toolbox to be used with other indicators.
Happy Trading.
Using the "Technical Insight" research tool under the Market Analysis tab, we have identified a bearish technical event.
The NZD/USD confirmed an Inside Bar candlestick pattern.

Source: GAIN Capital, Technical Insight
An Inside Bar develops during a strong uptrend when the trading range is completely within the boundaries of the prior bar. This suggests the balance between buyers and sellers is becoming more evenly balanced i.e. a weakening in power for the bulls and increasing in power for the bears.
Another bearish candlestick pattern has been confirmed in the AUD/USD which is highly correlated with the NZD/USD.
The AUD/USD confirmed an Engulfing Line candlestick pattern.

Source: GAIN Capital, Technical Insight
Following a clear uptrend, we see two candlesticks where the black real body of the second completely envelops the white real body of the first, showing that the bears have taken over from the bulls.
Although bearish reversal candlestick patterns are no guarantee that the trend will reverse, they are great warning indicators to be kept inside a trader's toolbox to be used with other indicators.
Check out what other technical events are forming now in the FX market by exploring Technical Insights in the market analysis tab on web trader today!
Happy Trading.
市场最新资讯
三月 28, 2023 02:13 上午
十月 28, 2022 04:43 上午
十月 28, 2022 04:43 上午
八月 19, 2022 05:44 上午
七月 26, 2022 03:43 上午
五月 10, 2022 02:22 上午


