According to S&P Global's flash PMI survey data, US business activity growth remained strong in August, pointing to continued economic expansion in the third quarter.
Growth differentials widened further, with the services sector rising at a robust and increased rate, while manufacturing output fell at the fastest rate in 14 months.
The Flash Composite PMI Output Index was 54.1 in August, down slightly from 54.3 in July and a four-month low.
The Flash US Services Business Activity Index rose to 56.0 in August from 55.3 in June, a 28-month high. The services sector outpaced the manufacturing sector for the fourth consecutive month.
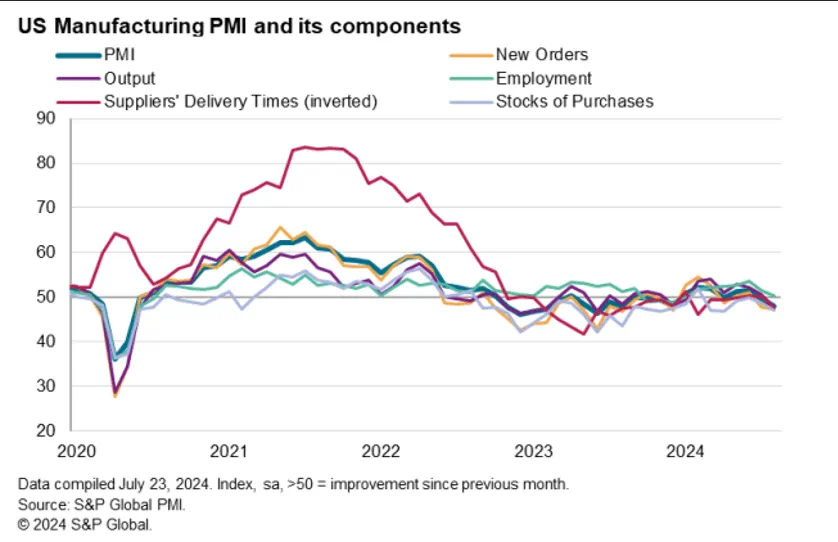
The Flash US Manufacturing PMI fell to 48.0 from 49.6 in July, marking an eight-month low. All five PMI components fell in August, as manufacturing employment growth slowed to near-stagnation.
Meanwhile, employment declined as gloomier expectations in manufacturing caused a near-stall in recruiting, while service sector payroll levels fell due to hiring challenges.
Brighter news on inflation, with prices charged for goods and services rising at the slowest rate since June 2020, save a recent fall in January, but this was offset by a stubbornly high rate of input cost growth by historical norms.
Manufacturing PMI
The S&P Global Flash US Manufacturing PMI decreased from 49.6 in July to 48.0 in the month of August indicating that business conditions in the goods-producing sector deteriorated for the second consecutive month at the fastest rate since December. In August, all five PMI components weakened. New orders and stocks declined at a faster rate, while manufacturing production fell for the first time in seven months. Meanwhile, employment growth has slowed to the point of near stagnation. Supplier delivery times have also cut to the largest extent since February, indicating that suppliers are less busy amid weaker demand for raw materials: input purchases by factories fell at the fastest rate in eight months.
Nevertheless, stockpiles of finished items increased significantly for the third time in four months, with the recent accumulation of unfinished inventory being among the greatest recorded in the survey's history, generally reflecting lower-than-expected sales.

What can the US Manufacturing PMI show us
A lower US Manufacturing PMI can show a variety of issues in other economic segments, and lead to a variety of knock-on effects in other parts of the economy. Simply, it shows the current manufacturing by the specific economy.
Why is it important and what if it goes lower?
If the US manufacturing PMI continues going lower, then this could indicate that the manufacturing output is declining further. If it does decline further, then this could signal a broader economic slowdown due to:
Lower Business Confidence: As manufacturers may reduce production due to current or anticipated weaker demand, higher costs or manufacturing, or supply chain issues.
This in turn could lead to reduced revenues and purchases for companies and decreased hiring or even job cuts in the sector, contributing to higher unemployment rates.
This is particularly concerning because manufacturing is often seen as a leading indicator of overall economic health.
FED reaction: If the Manufacturing is indeed lower, this could help the FED reconsider the current interest rates, and potentially lead to more accommodative monetary policy sooner to support economic growth.
If the Manufacturing PMI however drops too fast too soon, then financial markets may react negatively to a steady lower PMI, as it could increase concerns about a potential recession or economic weakness.
As I see, it is all a balancing act, in which we hope nothing will be blown out of proportion…
S&P 500 Technical analysis

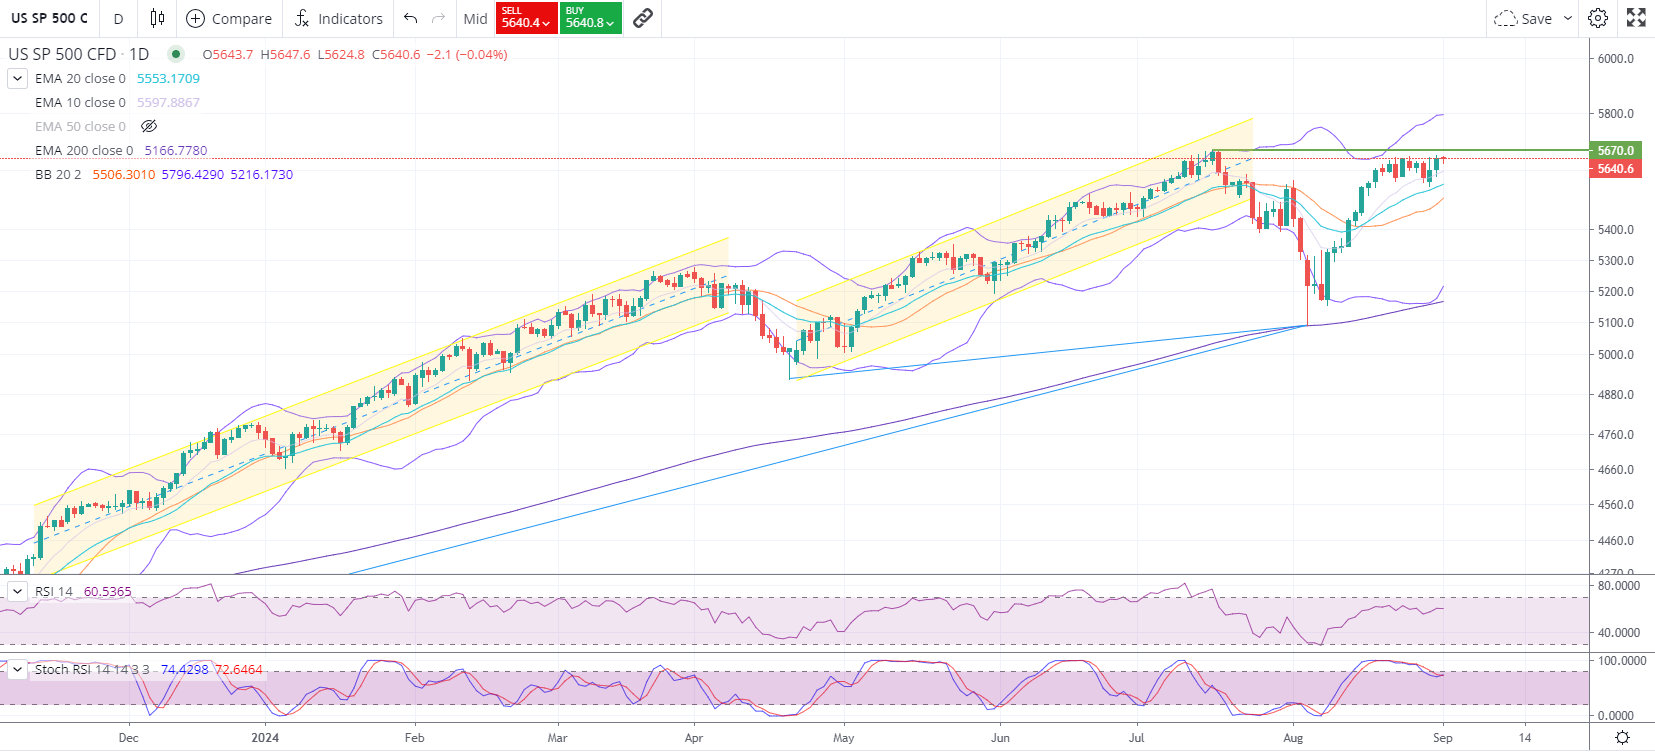
EMA 20: 5428.6060
EMA 50: 5432.5717
EMA 200: 5114.9357
Bollinger Bands: Upper Band: 5639.2018, Lower Band: 5182.0092
RSI (14): 59.5953
Stochastic RSI (14,3): 99.8853 (K), 94.0603 (D)
Considering that the price is trading above the EMA 20, EMA 50, and EMA 200 levels, the current sentiment appears bullish.
The price is near the upper Bollinger Band, indicating potential overbought conditions but also a strong upward trend.
RSI is at 59.5953, suggesting a bullish bias and the possibility for the price to extend further from these levels.
However, the Stochastic RSI has just come under the overbought level, potentially hinting at waning overbought conditions, seeing that the price has been trading in a range for the past 10 trading sessions, and thus a sustained push higher is possible if the Strength does not shoot right into overbought territories.
To the downside, the first support level is around the EMA 20 at approximately 5500.
A break beneath the 5500 level, could see the price challenge the lower Bollinger band at the 5,220 level.
To the upside, the Initial target lies at the top Bollinger band at 5800.0, considering the psychological resistance and recent highs this will take some work to overcome.
Trade smart,
Philip


