Key Events:
- USDJPY holds above the 140-mark despite 50 bps rate cut
- Silver climbs back above 31 with the rate cut boost
- Gold sets a record high at 2600
- BOJ monetary policy in focus on Friday for USDJPY volatility
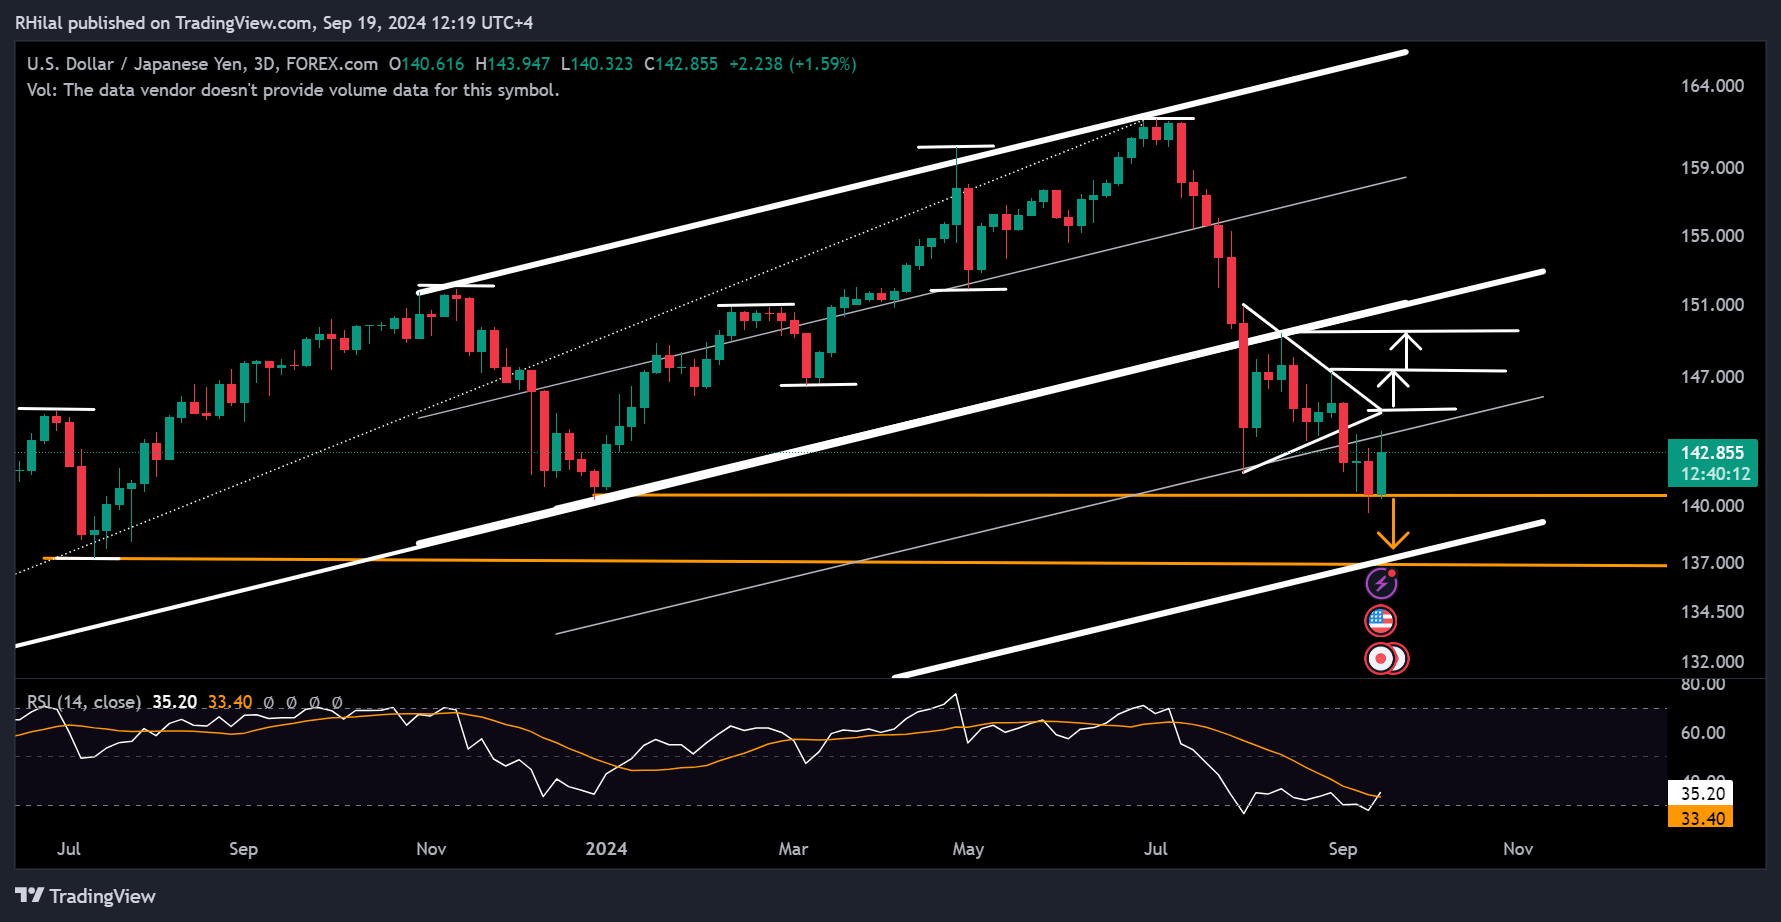
USDJPY Analysis: USDJPY – 3 Day Time Frame – Log Scale

Source: Tradingview
Beyond the 50-bps cut decision, the US Dollar index retested July 2023 lows and held its grounds over the December 2023 low (100.50). Consequently, the USDJPY pair maintained its grounds above the 140-barrier and retested the 144-resistance at the mid-level of the extended parallel channel.
The oversold state of the relative strength index (RSI) indicator is supporting a bullish reversal as well ahead of the BOJ policy rate and statement. The USDJPY scenarios remain in the following manner:
Bearish Scenario
A close below the 140-barrier can support a drop in the USDJPY towards the 137-support and 130-128 support zone respectively.
Bullish Scenario
A close above 144 can boost an uptrend towards levels 147 and 150 prior to confirming an overall bullish scenario for the USDJPY. The primary trend above the 150-barrier can confirm a possible uptrend continuation for the pair.
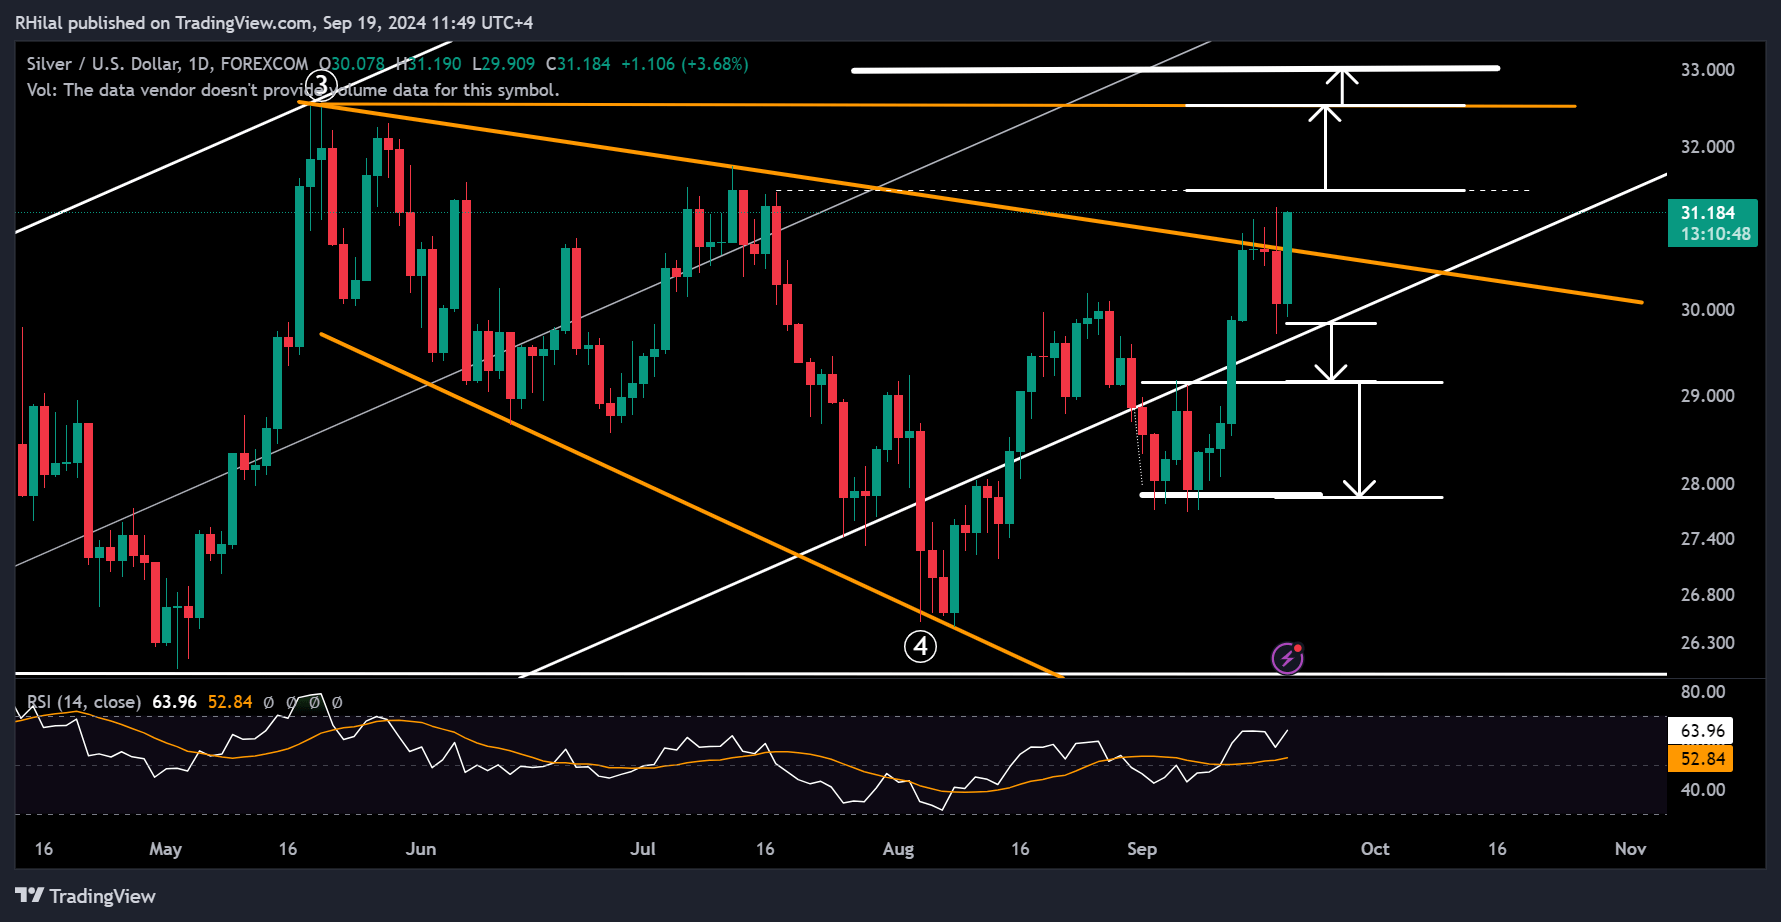
Silver Analysis: XAGUSD – Daily Time Frame – Log Scale

Source: Tradingview
Following Gold’s lead towards a new all-time high, which rebounded from the psychological 2600 barrier, Silver is trading back above the 31-barrier and above the expanding consolidation that has been trending between May 2024 and September 2024. Following that bullish breakout, a close above 31.50 is expected to boost silver prices back towards the 2024 high at the 32.50 level.
The next point in sight following the yearly high is the 33-barrier, as it aligns with the 0.618 Fibonacci extension level between the low of January 2024 (21.92), high of May 2024 (32.50), and low of August 2024 (26.60). From the downside, corrections are expected to hold at the 30-29.70 zone. Deeper retracements below that range are expected to re-align with the 27.80 support.
With an uncertain atmosphere around US elections, geopolitical tensions, and monetary policies, the primary uptrend trend on safe haven assets is expected to proceed.
--- Written by Razan Hilal, CMT – on X: @Rh_waves


