Canadian Dollar Outlook: USD/CAD
USD/CAD extends the series of lower highs and lows from the start of the week as Canada’s Consumer Price Index (CPI) prints at 2.0% in October versus forecasts for a 1.9% reading, with the recent decline in the exchange rate pulling the Relative Strength Index (RSI) below 70.
USD/CAD Rally Unravels to Pull RSI Back from Overbought Zone
USD/CAD trades to a fresh weekly low (1.3951) as the uptick in Canada’s CPI curbs speculation for another Bank of Canada (BoE) rate-cut, and the central bank may move to the sidelines at its last meeting for 2024 as ‘the timing and pace of further reductions in the policy rate will be guided by incoming information and our assessment of its implications for the inflation outlook.’
Join David Song for the Weekly Fundamental Market Outlook webinar. David provides a market overview and takes questions in real-time. Register Here
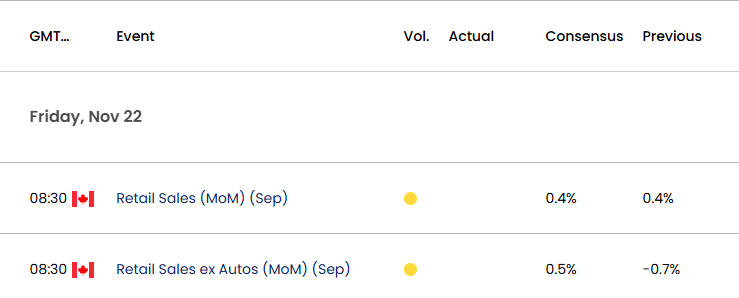
In turn, USD/CAD may continue to give back the advance from the monthly low (1.3821) should the bearish price action persist, and Canada’s Retail Sales report may fuel the recent weakness in the exchange rate as the update is anticipated to show an ongoing expansion in household consumption.
Canada Economic Calendar

Canada Retail Sales are projected to increase another 0.4% in September, and a positive development may generate a bullish reaction in the Canadian Dollar as it encourages the BoC to pause its rate-cutting cycle.
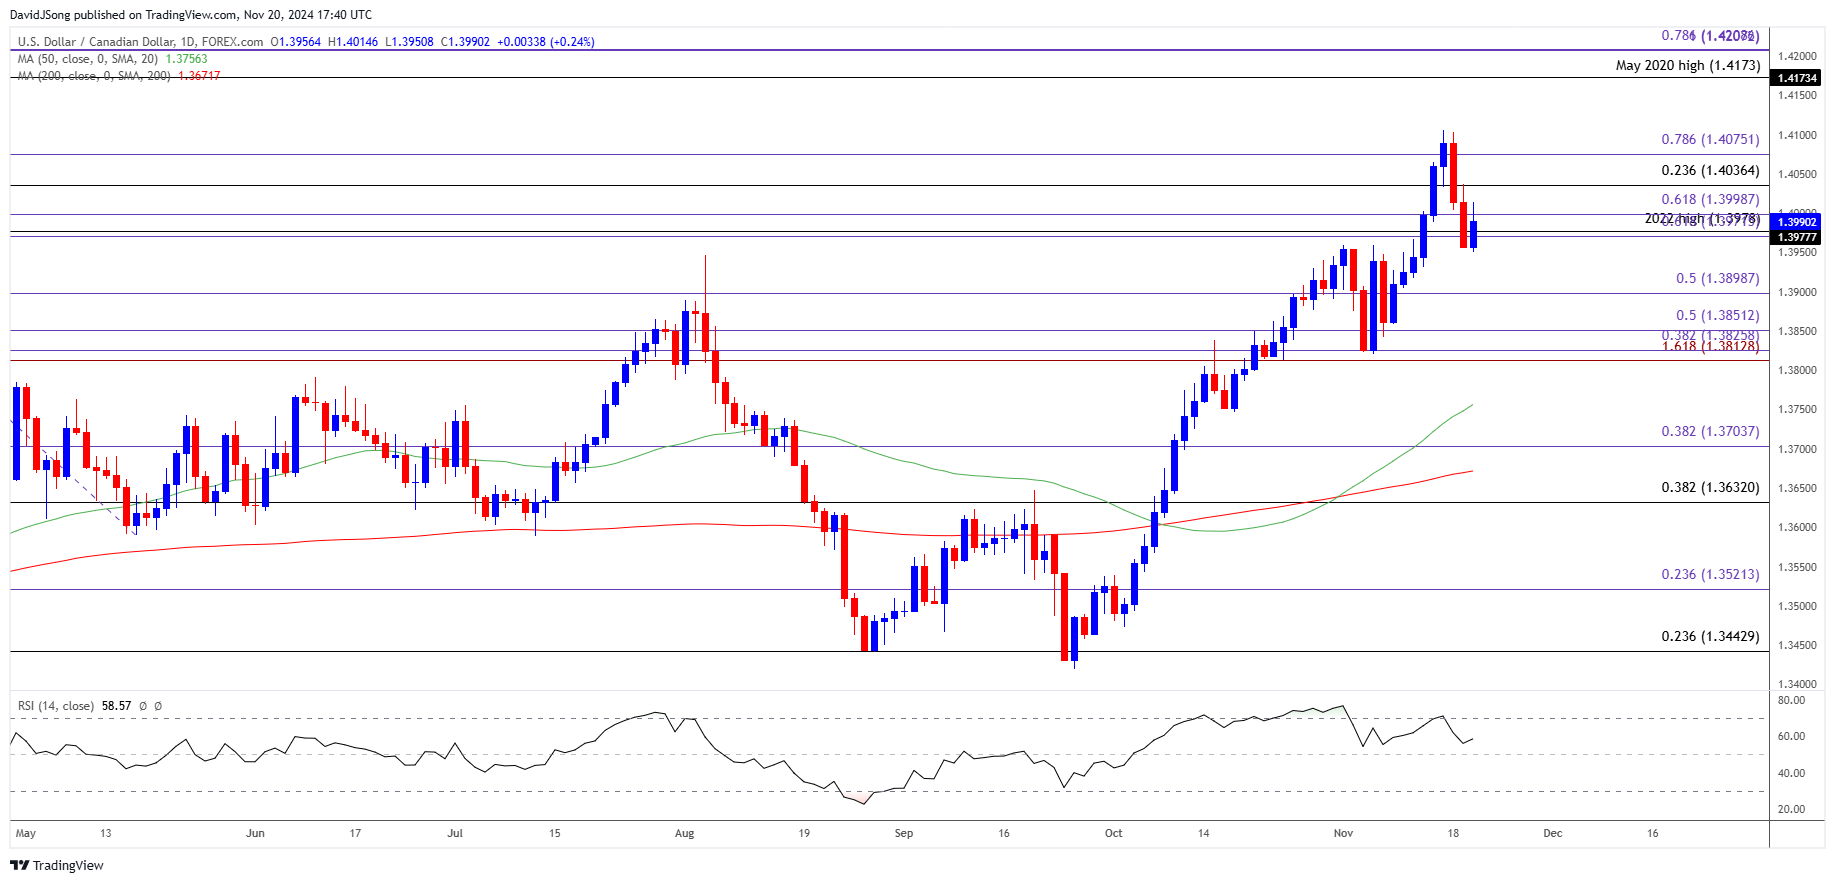
With that said, USD/CAD may continue to trade to fresh weekly lows as the RSI falls back from overbought territory, but the exchange rate may attempt to retrace the decline from the monthly high (1.4106) should it break out of the bearish price series.
USD/CAD Price Chart – Daily

Chart Prepared by David Song, Strategist; USD/CAD Price on TradingView
- USD/CAD may continue to carve a series of lower highs and lows as it struggles to hold above the 1.3970 (61.8% Fibonacci extension) to 1.4000 (61.8% Fibonacci extension) region, with a breach below 1.3900 (50% Fibonacci extension) raising the scope for a move towards the monthly low (1.3821).
- A break/close below the 1.3810 (161.8% Fibonacci extension) to 1.3850 (50% Fibonacci extension) area opens up 1.3700 (50% Fibonacci extension) but the recent pullback in USD/CAD may end up short-lived should it defend the weekly low (1.3951).
- Need a move above the 1.4040 (23.6% Fibonacci retracement) to 1.4080 (78.6% Fibonacci extension) zone for USD/CAD to clear the bearish price series, with a breach above the monthly high (1.4106) opening up the May 2020 high (1.4173).
Additional Market Outlooks
GBP/USD Struggles as BoE Bailey Sees Faster Disinflation
Gold Price Recovery Keeps RSI Above Oversold Zone
US Dollar Forecast: EUR/USD Rebound Pulls RSI Out of Oversold Zone
USD/JPY Rebounds as BoJ Ueda Pledges to Support Economic Activity
--- Written by David Song, Senior Strategist
Follow on Twitter at @DavidJSong


