Weak demand for US 7-year treasuries sent Wall Street indices lower on Wednesday, on concerns that funding the US deficit will drive up yields alongside ‘higher for longer’ Fed rates. And that manifested with a higher US yields curve and a stronger USD, which enjoyed at strongest daily performance in over a month.
This week I have warned of a potential pullback on US indices, the Nikkei 225, gold, copper alongside a stronger US dollar. And so far, all boxes have been ticked. The question of course ifs whether this is a minor bump in the road or the beginning of something far more sinister.

Gold formed a daily dark-cloud cover and erased most of Tuesday’s gains to mark the 2-day low-liquidity rally as a dead-cat bounce. Yet the reward to risk for bears seems unfavourable around current prices as it hovers above Friday’s low. A similar pattern emerged on copper and silver remains supported beneath its record high. And as US futures held above key support levels, I suspect gold may hold above last week’s low, at least for now.
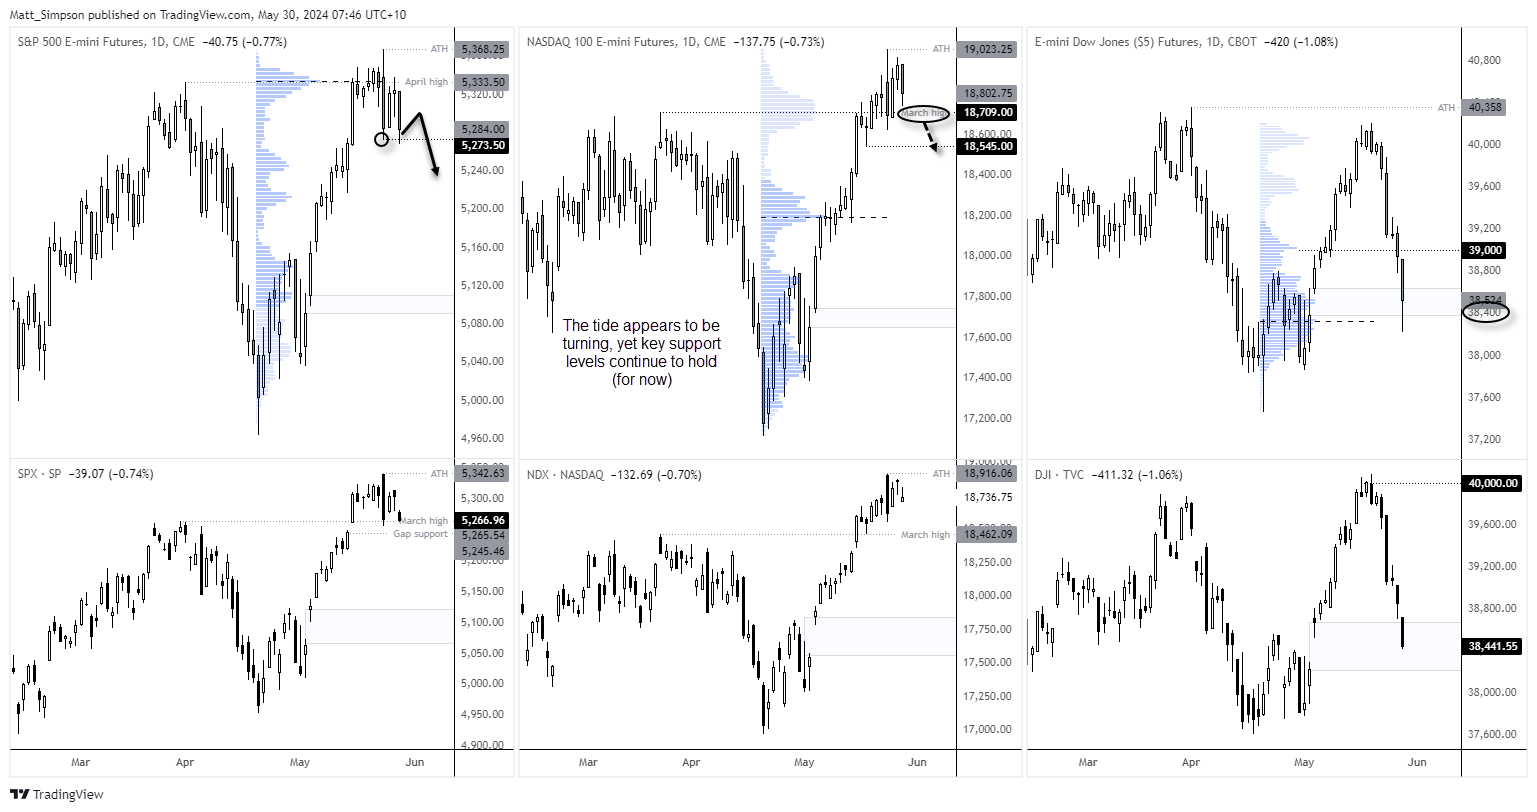
Wall Street indices don’t look too happy at their highs
US index futures were lower overnight, although the S&P 500 E-mini saw a false break of last week’s low and the cash market held above the March high, with gap support nearby. And with the Nasdaq 100 E-mini holding above the March high, it seems support is on hand to prevent a strong follow through. For now at least.
But if there is a canary in the coalmine it could be found in the Dow Jones which fell for a fourth day. The Dow E-mini contract filled gap support, which again points to near-term support. But as the week develops, they could break lower if traders get nervous about a hot or sticky PCE inflation report, or simply selloff if one arrives on Friday. And that could make for a messy close as traders will presumably want to avoid weekend gap risk and stampede for the exit before Friday’s close, sending risk broadly lower.

US dollar technical analysis:
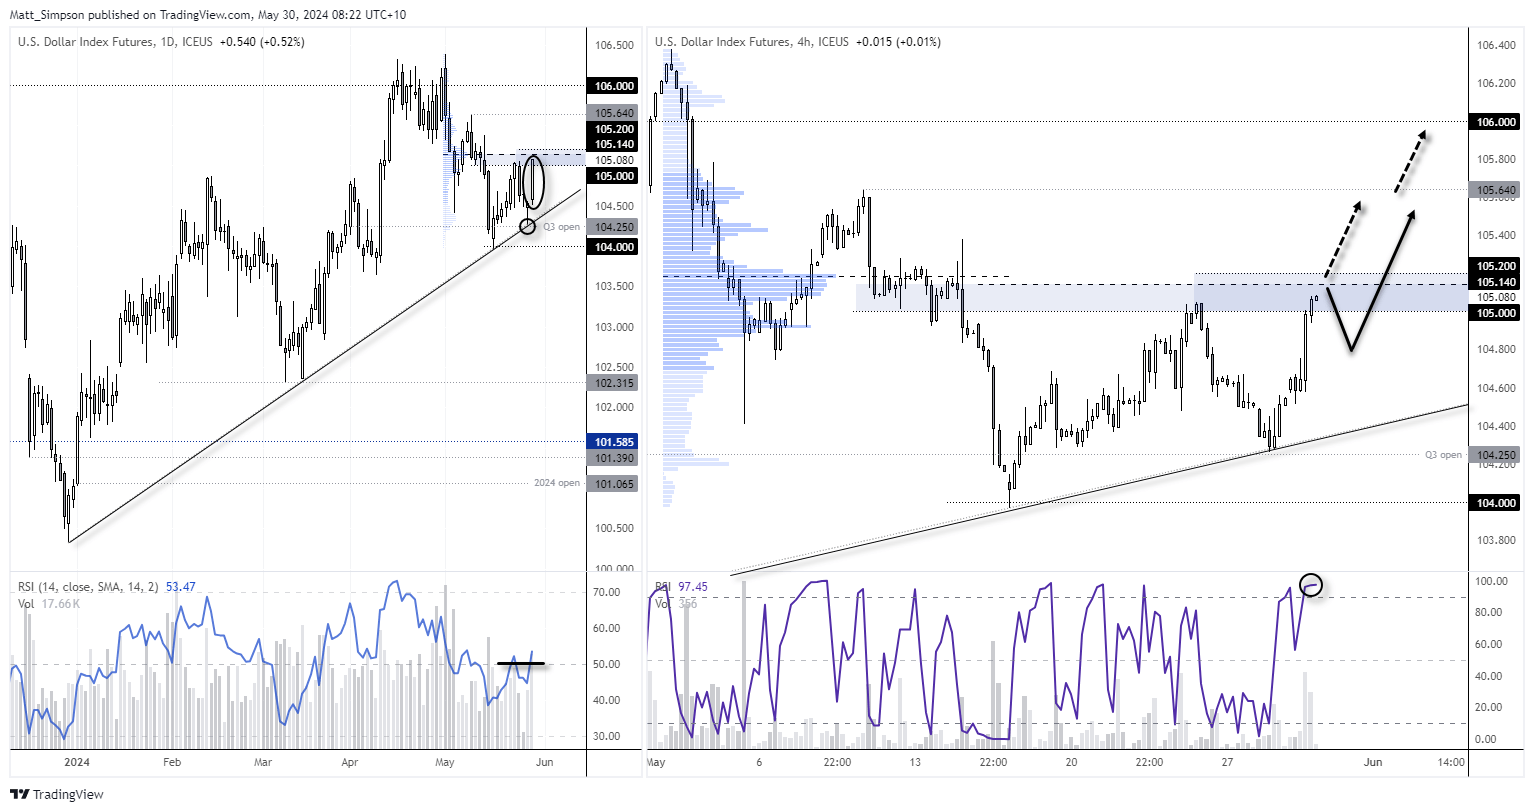
We're finally seeing the resurgence of the US dollar we've been waiting for, which reclaimed its throne as the strongest forex major on Wednesday. Trend support from the December low held perfectly for its third retest with today's bullish hammer. Wednesday's trade opened near the low of the day and closed near its high. Trading volume was the highest in nine days, and it was the strongest daily performance in a month. The daily close above 105 was the cherry on the cake and has earned the USD a place in my 'buy the dip' watchlist.
Take note of likely resistance around the 105.14 high-volume node and 102 handle. The 1-hour RSI (2) is also overbought, with prices just beneath resistance. But it seems more likely to break above it than not, which makes dips beneath it favourable for bullish setups.

Economic events (times in AEST)
- 09:50 – Japan’s foreigner bond, stock purchases
- 10:00 – SNB board member Jordan speaks
- 11:00 – NZ budget balance
- 11:30 – Australian building approvals, Capex
- 12:00 – NZ annual budget release
- 17:00 – Spanish CPI
- 19:00 – European sentiment indicator
- 22:30 – US Q1 GDP, PCE prices Q1, jobless claims
- 22:30 – Canada average weekly earnings
View the full economic calendar
-- Written by Matt Simpson
Follow Matt on Twitter @cLeverEdge


