- USD/JPY hits fresh highs as US yields spike
- Yen weakness push Nikkei 225 futures towards key resistance
- Fed and BoJ rate decisions on Wednesday and Thursday respectively
- Bullish setups emerge for both USD/JPY and Nikkei 225 futures
Overview
The upside move in benchmark US Treasury yields anticipated in last Friday's USD/JPY outlook has materialised, lifting the pair to fresh weekly highs. The tight interplay between technicals and correlations remains intact, despite the backdrop of significant risk events. This dynamic offers a potential framework for setups in the coming week.
The yen's weakness has also caught the attention of Nikkei 225 traders. Improving corporate earnings prospects are beginning to counterbalance concerns about US President-elect Donald Trump's proposed tariff measures, generating near-term tailwinds for Japanese equities.
Bond bloodbath boosts USD/JPY bulls
Last week was a bloodbath for US bonds, especially at the long end of the curve. Benchmark 10-year Treasury yields spiked 24.6bps, sending them to within touching distance of the highs struck immediately after Donald Trump’s victory in the US Presidential election.

Source; TradingView
A 16bps reduction in the scale of rate cuts expected from the Fed by the end of 2025 may have been a factor, helping to lift yields further out the curve in anticipation of a hawkish cut on Wednesday, but technicals arguably provided the clearest signal on the looming lift in yields.
Technical tea leaves prove accurate
You can see that in the 10-year US Treasury note futures chart, with losses accelerating last week as the price broke through the 200-day moving average and uptrend support dating back to November 15. The rout subsequently stalled at known horizontal support on Friday, further bolstering the message coming from technicals.

Source: TradingView
With RSI (14) and MACD generating bearish signals, the path of least resistance comes across as lower, not higher. At the very least, selling rallies and bearish breaks is preferred near-term.
Note the strong inverse correlation between benchmark Treasury futures and USD/JPY in the bottom pane, sitting at -0.92 over the past month. As price moves inversely to yields, the readthrough is USD/JPY remains highly influenced by the US interest rate outlook.
USD/JPY takes out another resistance level

Source: TtradingView
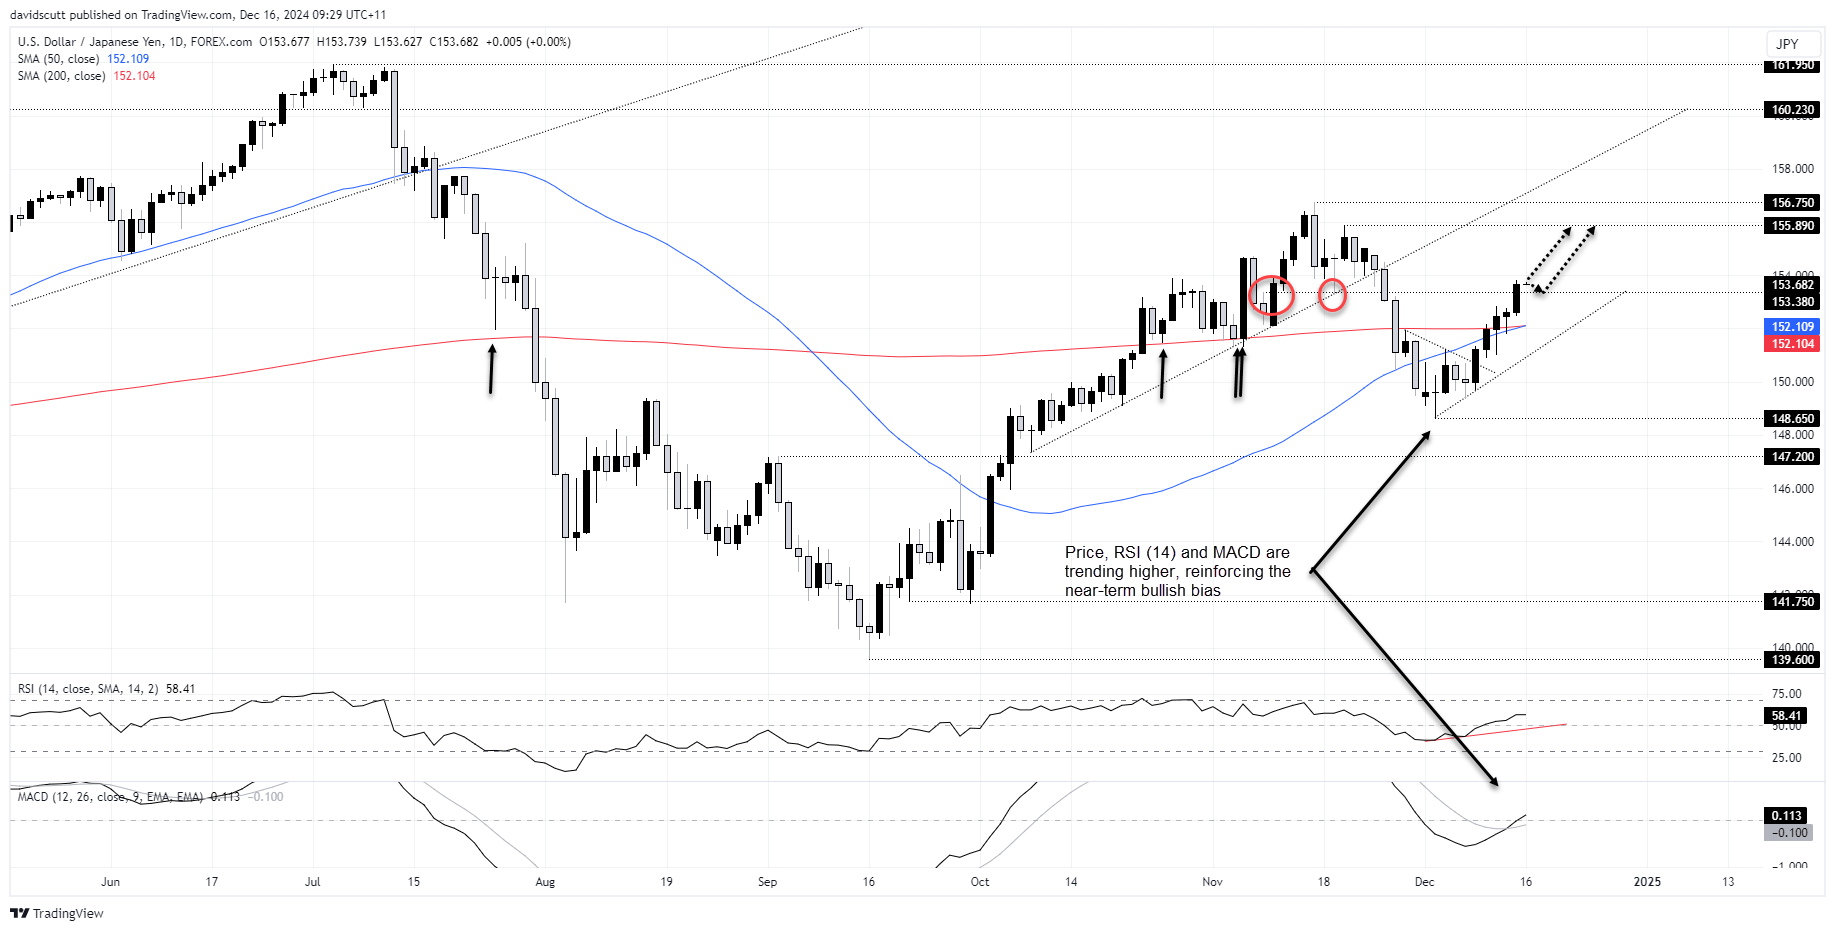
With US benchmark yields pushing higher, it’s fuelling USD/JPY upside, seeing the price take out resistance at 153.38 on Friday after doing away with the 50 and 200-day moving averages earlier in the week. With RSI (14) and MACD providing bullish signals on momentum, the bias is to buy dips and bullish breaks.
The move above of 153.38 provides a bullish setup for those seeking ideas, with potential pullbacks towards the level allowing for longs to be established with a tight stop beneath for protection. Possible topside targets include 155.89 and 156.75.
If the price were to reverse back through 153.38, potential short setups don’t screen as particularly appealing with the key 200-day moving average located nearby. Unless you’re an intraday scalper, the risk-reward looks skinny.
Nikkei bulls eye range break
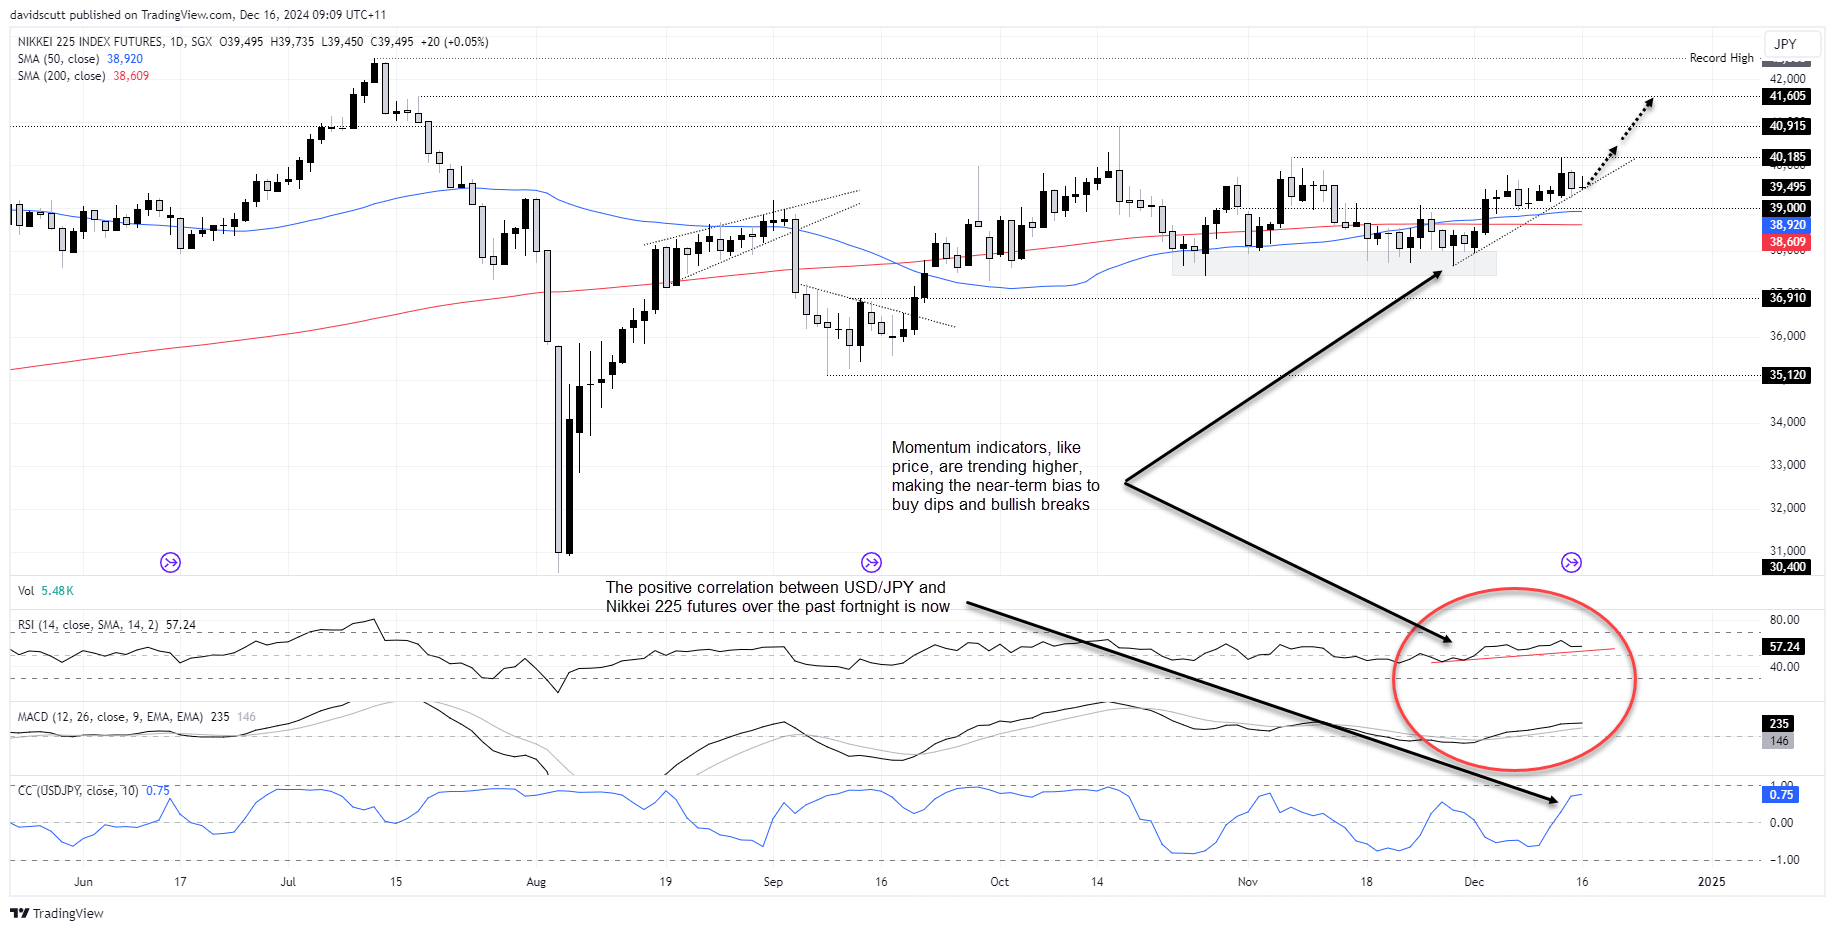
The bullish break in USD/JPY may be starting to influence Nikkei 225 futures with the rolling correlation between the two strengthening to 0.75 over the past fortnight, a level only seen once over the past two months.
Nikkei futures have been rangebound for months, limited by buying support below 38000 on the downside and sellers parked above 40000 on the topside.
More recently, however, futures have pushed towards the top of the range, finding support at 39000 and a minor uptrend dating back to late November. With RSI (14) and MACD signalling building topside momentum, traders should be alert for a bullish breakout in the short to medium-term.

Source: TradingView
The uptrend is found around 39450 today, close to where the price closed on Friday evening. If it were to hold, traders could look to buy above it with a tight stop beneath for protection. The price has run into sellers above 40000 the past five times it’s ventured there, making that an obvious initial target.
Alternatively, if the price were unable to hold the uptrend, the bullish bias would be void, allowing for setups to trade the existing range with support located in between at 39000.
Now read: USD/JPY weekly outlook: Fed and BoJ decisions to ignite FX market volatility
-- Written by David Scutt
Follow David on Twitter @scutty


