Traders appear to be booking profits ahead of a key US GDP report later today, and a highly anticipated PCE inflation report tomorrow. The US dollar was the strongest major currency on Fridy after the USD index provided a solid bounce from thew 100 handle.
This saw EUR/USD reverse back below 1.12 and formed a 2-day bearish reversal, GBP/USD form a bearish outside day and bearish engulfing days form on AUD/USD. US yields were also higher which helped USD/JPY close 144 for the first time in three weeks.
The S&P 500 reversed lower after reaching an intraday record high, while the Dow Jones index delivered a noteworthy bearish outside day at its own record high. And with news of China’s stimulus fading, that could weigh on the Hang Seng futures, which held beneath the May high on Wednesday and saw a false break of it on Tuesday.

Australia’s inflation rate fell to a 3-year low of 2.7% y/y in August, which places it back within the RBA’s 2-3% band. Yet the market reaction was muted as the central bank has already said it will look through the headline figures, as much of the declines are due to rebates on electricity. Trimmed mean - The RBA’s preferred measure of CPI – slowed to 3.4% and CPI less ‘volatile items and travel’ to 3.1%. The inflation rate is moving in the correct direction for doves, just not as quickly as they’d like. Which means the RBA are likely to retain their cash rate at 4.35% into next year.
Events in focus (AEDT):
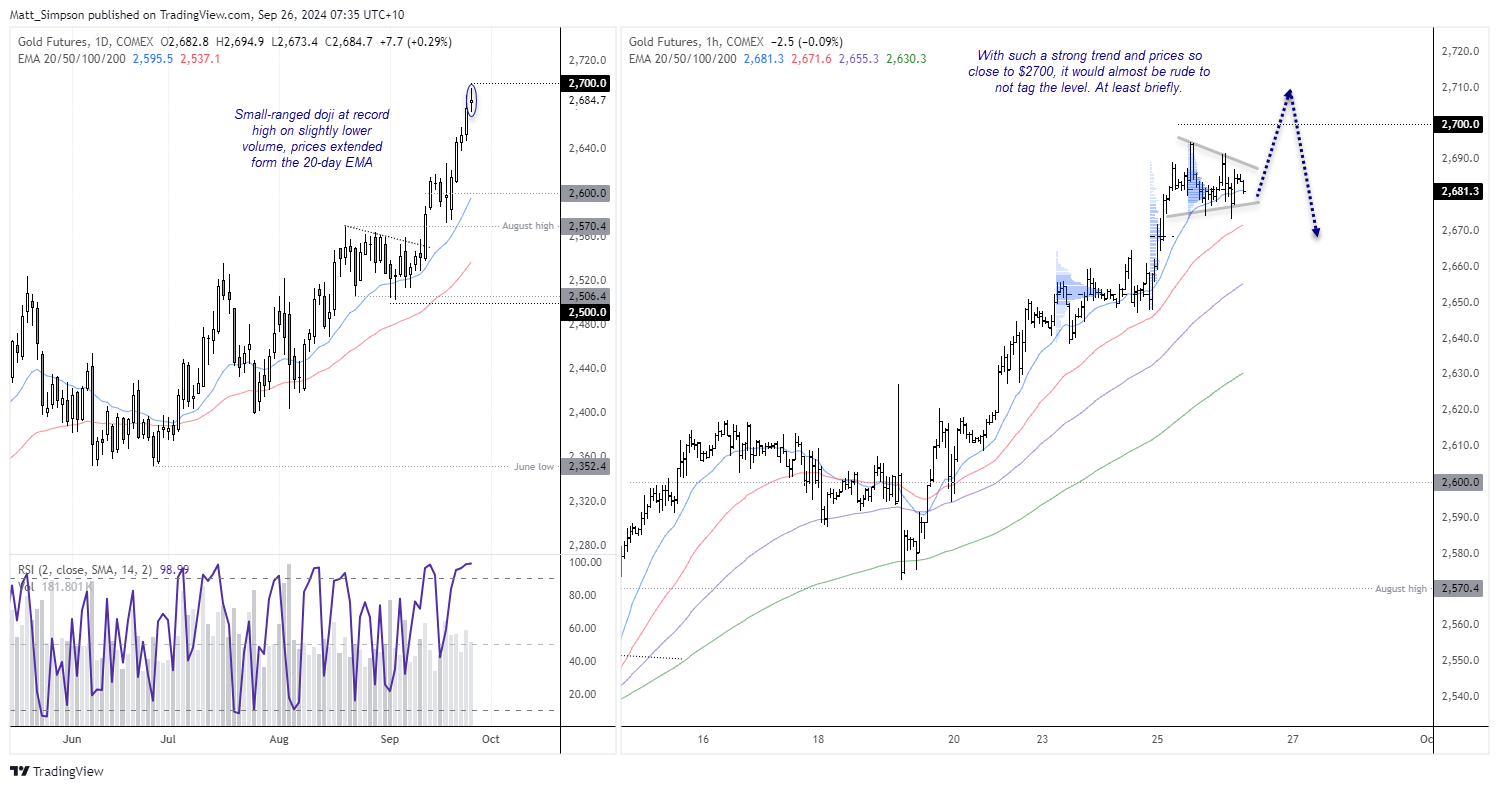
We have quite the lineup of data from the US later today, with preliminary US GDP data for Q2 being released alongside jobless claims and durable goods orders. While GDP is backwards looking, it will stail shape expectations of any soft or hard landing and Fed policy as a consequence. With gold looking extended at its record highs, a decent set of growth figures could prompt some profit taking (and therefore mean reversion) ahead of tomorrow’s PCE inflation report.
Keep a close eye on the jobless claims figures given initial claims fell at their fastest weekly pace since May 2022 last week. Another weak print could further excite USD bears as it piles the pressure on the Fed to cut by more than their anticipated 50bp this year.
The SNB are expected to cut their interest rate by 25bp, although the bigger thing to watch out for is any working around a strong franc. Swiss exporters have been lobbying for a weaker currency and the central bank have been making noises around it. ING analysts also suspect that the SNB have been active franc sellers when USD/CHF reaches 0.84 or EUR/CHF falls to 0.94, which makes them key levels to monitor for any potential spikes higher.
- 09:50 – JP foreigner bond, stock purchases
- 12:30 – RBA financial stability review
- 15:00 – SG industrial production
- 16:00 – DE consumer sentiment
- 17:30 – SNB monetary policy decision (-25bp expected)
- 22:30 – US Q2 GDP, PCE prices, consumer spending, corporate profits, durable goods orders, jobless claims
Gold futures technical analysis:
While several metrics pointed to a sentiment extreme for gold bulls, I noted during the consolidation around 2500 that speculative open interest was low by historical standards. Which suggested many were on the sidelines and could re-enter the gold ring upon a breakout. With gold prices around $200 higher, speculative gold bugs appear to be returning.
Yet while gold prices appear extended on the daily, it trades too close to $2700 for gold bugs to not have another crack at it. And given the strong trend on the 1-hour chart with potential bull flag, I suspect small dips may be bought today and we may see prices make a dash that milestone level. However, I also suspect gold prices will struggle to hold above there, and profit taking may be too tempting and a pullback could occur. Especially if GDP data comes in better than expected.

Crude oil technical analysis:
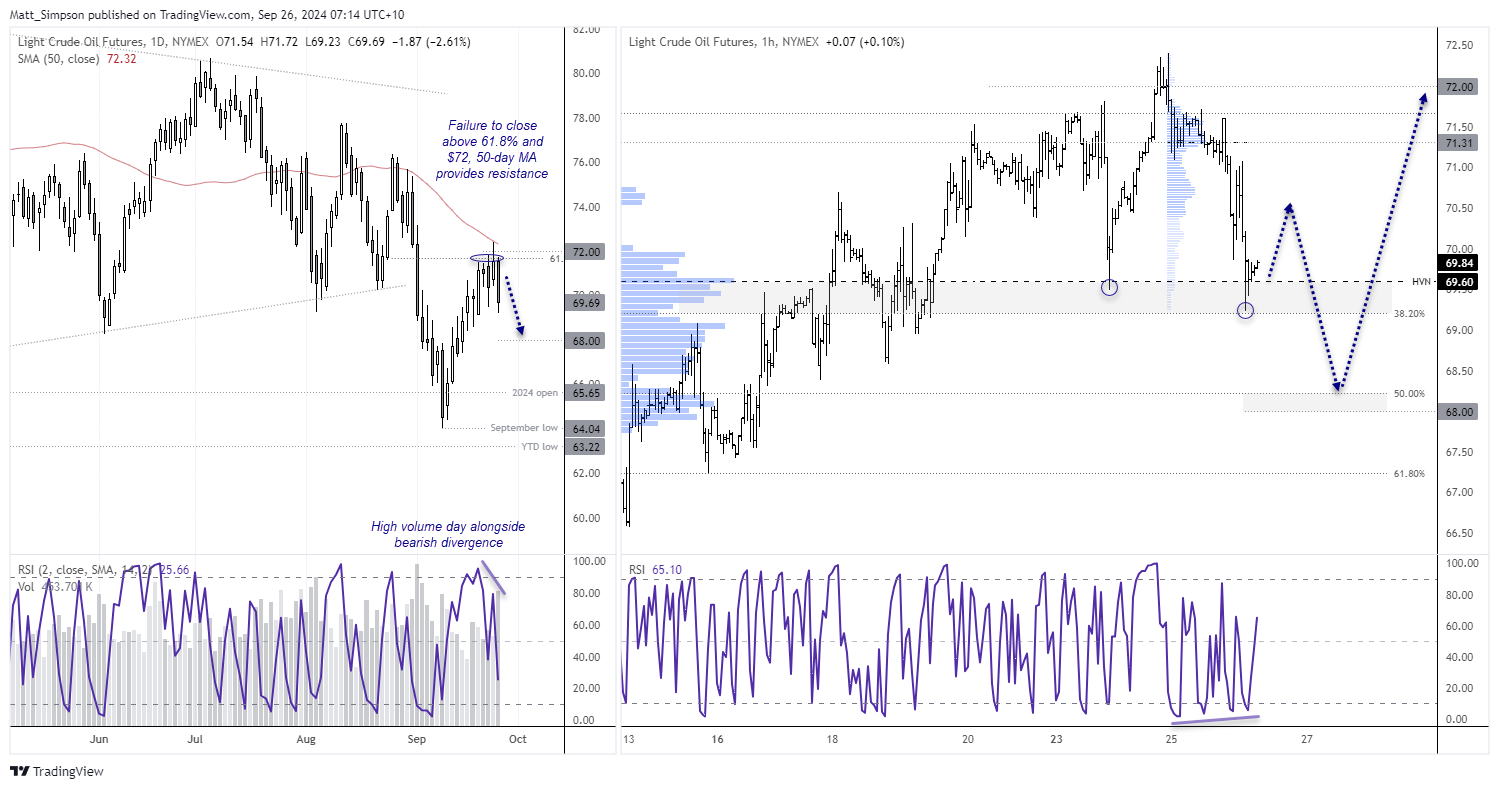
Crude oil prices bounced 8.4% over the past 10 trading days, thanks to a dovish Fed, weaker US dollar and rising concerns in the Middle East. Yet the latter two drivers worked against crude oil prices on Wednesday, with the front-month futures contract falling below $70 during its most volatile down-day since the 64.04 low.
Note crude oil’s inability to close above $72 or the 61.8% Fibonacci level on the daily chart. The week’s high also perfectly respected the 50-day average as resistance. As for market positioning, gross-long exposure fell to its lowest level in 14 years according to the last COT data, which suggests the recent rise for crude oil prices could be corrective.
Still, prices found support around a high-volume node and a spike low formed on the 1-hour chart. I suspect we could be in for at least a minor bounce from current levels today. But given the bearish price action on the daily chart, the preference is to fade into bounces in anticipation of a move down to $68.

View the full economic calendar
-- Written by Matt Simpson
Follow Matt on Twitter @cLeverEdge


