- Tariff threat postponed, not removed; headline risk remains elevated
- AUD/USD breaks key resistance; close above 0.6247 will boost bullish signal
- EUR/USD breaks wedge; move stalls beneath 50DMA
- Hang Seng futures rally; watch 20,158 for breakout confirmation
Summary
No immediate tariff implementation from the Trump Administration sparked a sharp rally in cyclical assets on Monday, particularly those tied to China, as markets quickly unwound worst-case trade policy scenarios. This shift saw AUD/USD, EUR/USD and Hang Seng futures surge, breaking key long-term resistance levels.
But is this rally a false dawn, setting up an epic bull trap? The threat of tariffs hasn’t disappeared, leaving headline risk extremely elevated in the days ahead. Markets are now eyeing a yet-to-be-released fact sheet that will outline Trump’s next steps on trade policy, details of which carry trillion-dollar consequences for markets.
This note will look at levels to watch in the coming days, providing a roadmap of sorts for traders to assess trade setups depending on how the price action evolves.
Tariff threat postponed, not eradicated
Donald Trump briefly touched on trade policy in his Presidential Inauguration speech, stating: “Instead of taxing our citizens to enrich other countries, we will tariff and tax foreign countries to enrich our citizens.”
Rather than announce specific measures, Trump has instructed his team to address unfair trade practices globally and investigate whether Beijing has complied with the deal signed during his first term, according to Bloomberg.
The accompanying fact sheet ominously warns that measures will be introduced to reverse the “destructive impact of globalist, America last trade policy.”
AUD/USD: Sustained Breakout or Trap?
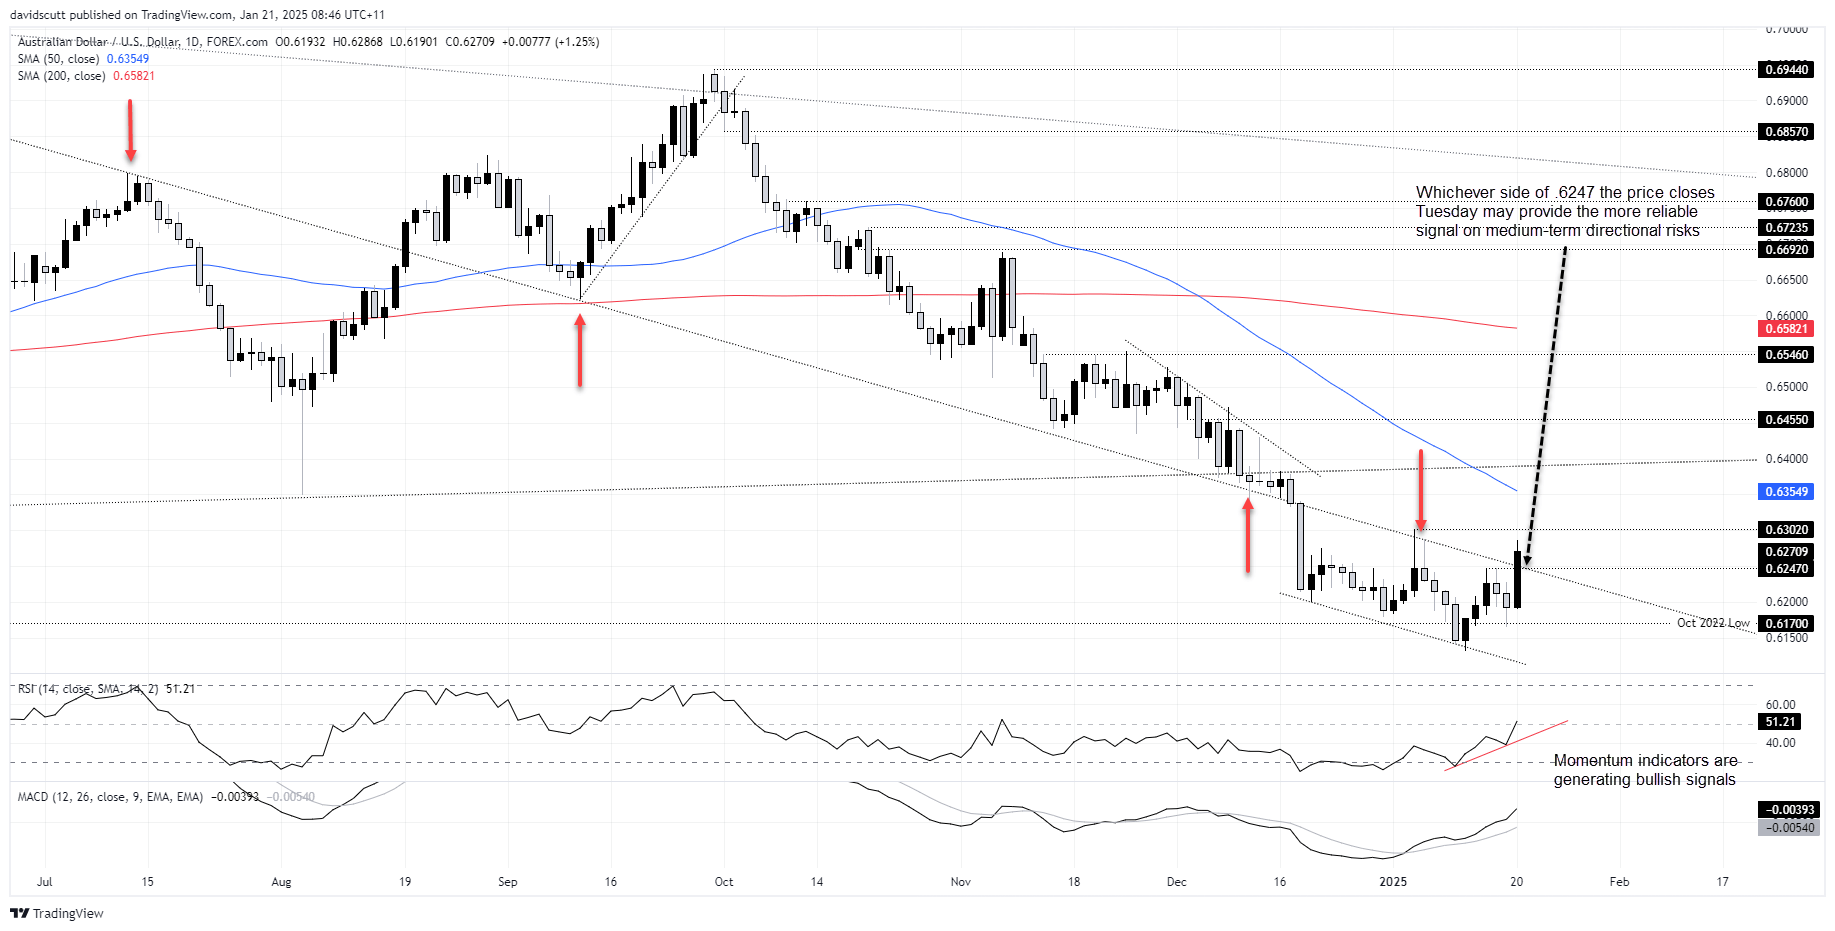
The Australian dollar, widely viewed as a proxy for China, has been among the biggest movers on the trade headlines. AUD/USD surged, breaking through a long-running downtrend that has acted as both support and resistance since July last year.

Source: TradingView
While the move looks impressive, it’s worth noting that US markets were closed for the Martin Luther King holiday, reducing liquidity and likely amplifying the scale of the rally. This raises doubts about the signal’s reliability, particularly since the tariff threat has only been delayed, not eliminated. It could easily turn into another bull trap, as seen in similar episodes recently.
To consider the bullish break sustainable, the price needs to close above the trendline on Tuesday when US markets reopen. This is especially crucial as it currently aligns with a minor horizontal level at 0.6247, which acted as resistance last week.
If the price holds and closes above this level, it cerates a decent bullish setup, allowing for long positions to be established above 0.6247 with a stop below for protection. Minor resistance may be encountered at 0.6302, the January 2 high, but the 50-day moving average and a long-term uptrend from pandemic lows offer more appealing targets.
Momentum indicators, including RSI (14) and MACD, are generating bullish signals, with both trending higher.
However, if AUD/USD reverses and closes beneath 0.6247, the bullish signal would be invalidated. This could see the setup to be flipped, allowing for shorts to be established beneath the level with a stop above for protection. Potential targets include 0.6170 and the January 13 low around 0.6130.
EUR/USD Stages Convincing Breakout, Eyes 50DMA
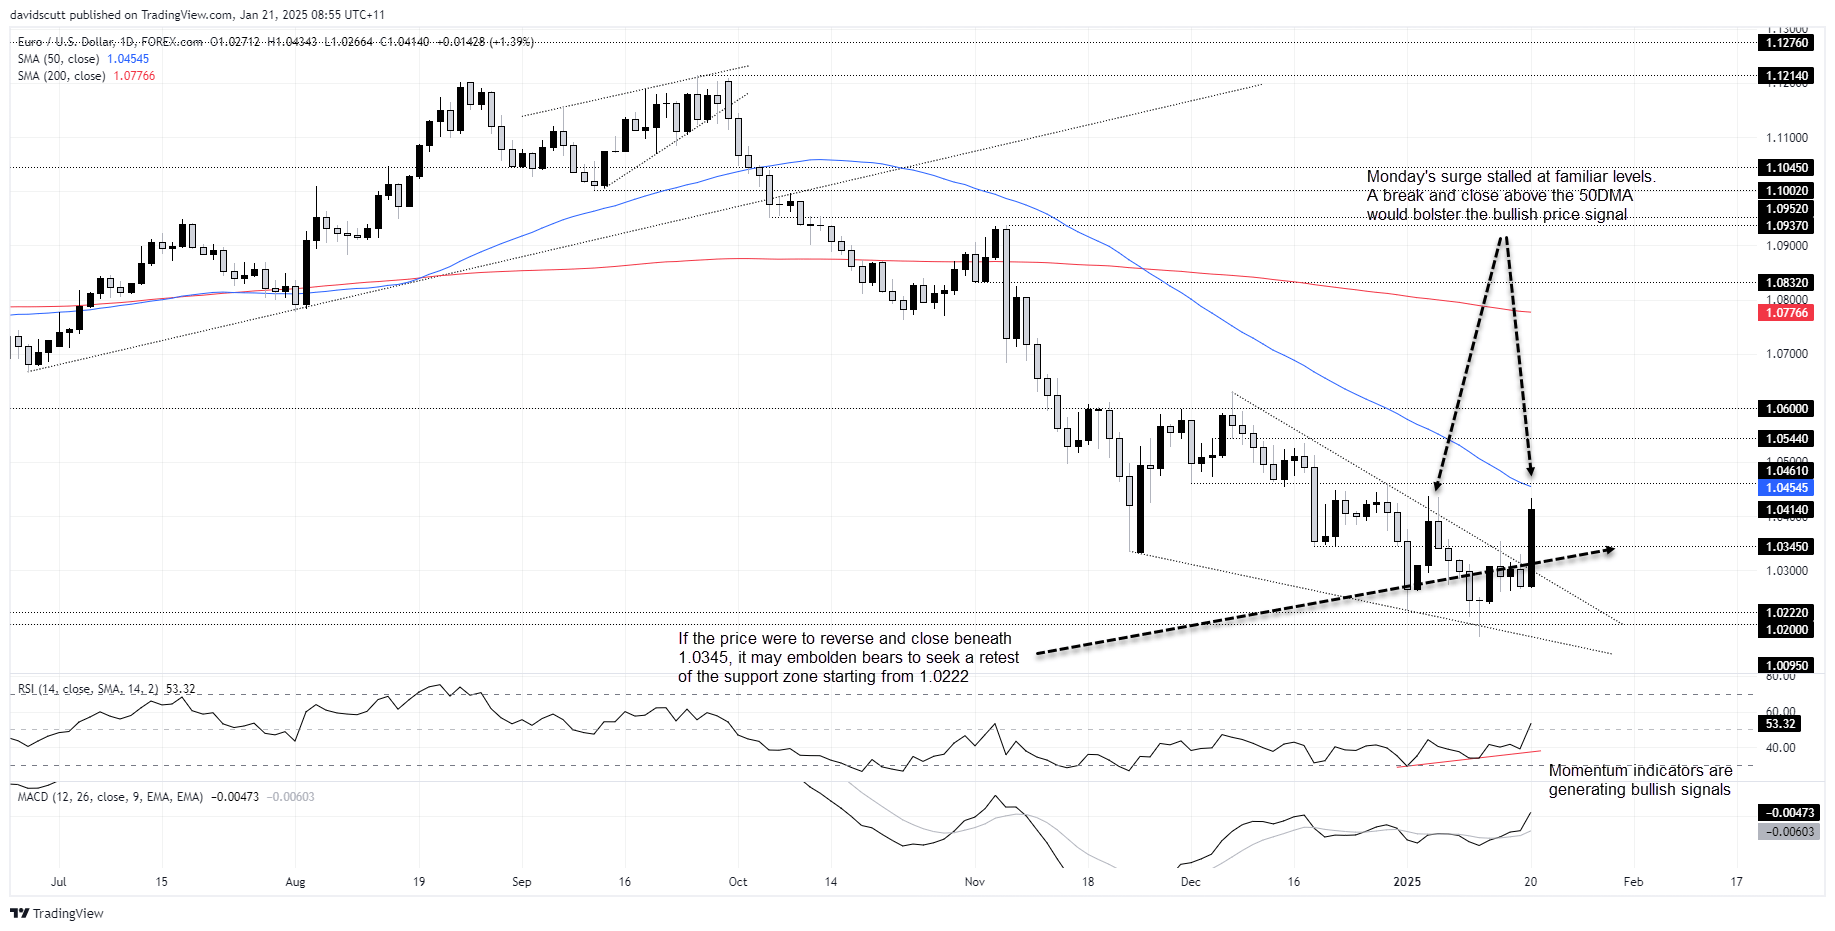
EUR/USD followed a similar path to SAUD/USD, breaking out of a falling wedge it had been trading in for the past two months. The velocity of the breakout appears more convincing, not only clearing the downtrend but also surpassing 1.0345, a level that has repeatedly acted as support and resistance in recent months.

Source: TradingView
Monday’s bounce stalled around 1.0430, mirroring the price action seen in another countertrend rally earlier this year. The price now sits just beneath the 50-day moving average. A close above this level could entice reluctant bulls to join the breakout party, opening the door to potential moves toward 1.0544 or 1.0600.
Momentum indicators, including RSI (14) and MACD, show dwindling bearish momentum has flipped positive, favouring the bulls.
However, a reversal and close beneath 1.0345 would negate the bullish signal, opening the way for potential bearish setups looking for a retest of the support zone beginning at 1.0222.
Hang Seng Close Important Tuesday

Source: TradingView
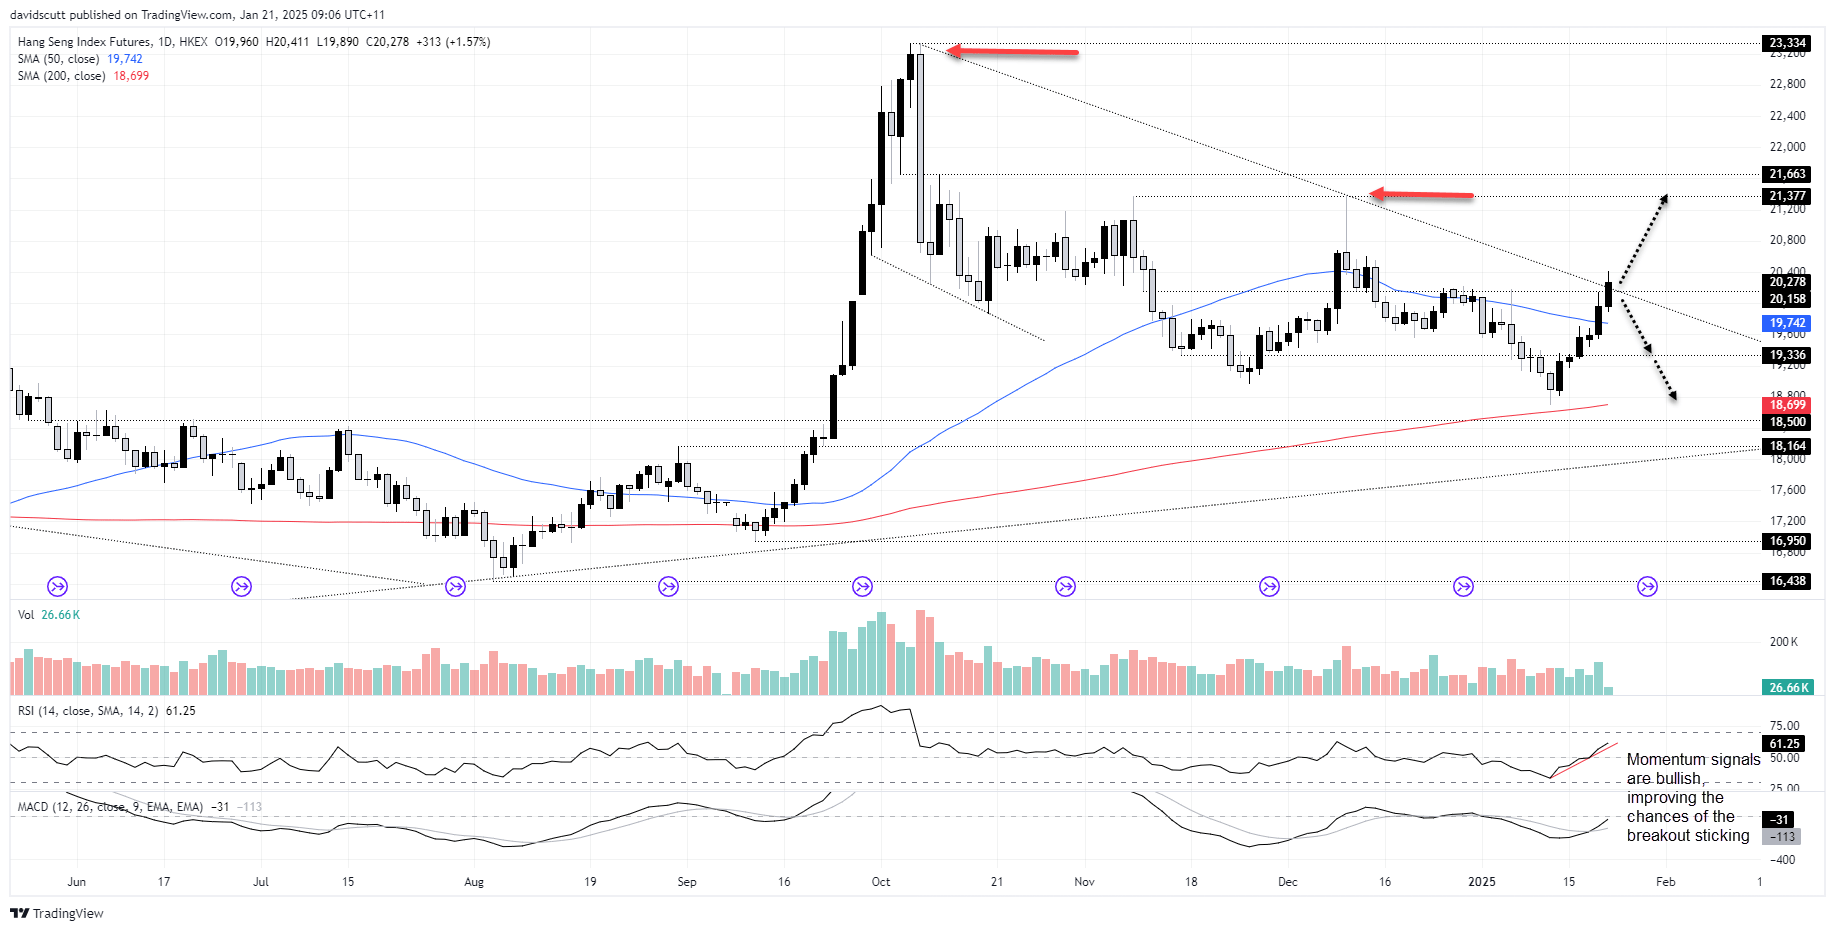
Hang Seng futures also rallied on the tariff headlines, breaking above a downtrend from October highs and clearing horizontal resistance at 20,158.
A close above this the latter would improve prospects for a move toward 21,377, the double-top established late last year. Traders considering long positions could buy above 20,158 with a stop below for protection.
However, failure to hold above this level would allow the setup to be flipped, allowing for short positions to be established beneath 20,158 with a stop above for risk management purposes. Possible targets include 19,336 and the 200-day moving average, depending on risk appetite.
For now, momentum indicators like MACD and RSI (14) are trending higher, suggesting a near-term bias to buy dips and topside breaks.
-- Written by David Scutt
Follow David on Twitter @scutty


