US Dollar Talking Points:
- I looked at support test in EUR/USD from a level shown in the Tuesday webinar, and that bounce has since extended, helping to prod pullback in the USD.
- The question now is trend resumption potential and given the DXY rally, there’s several nearby levels to investigate for possible higher-low support.
- I dig into both markets each week in the Tuesday webinar, and it’s free to join: Click here for registration information.
It’s been a massive push so far in Q4 and the US Dollar has quickly pushed into overbought territory on the daily as EUR/USD has made a fast move into oversold. As I had looked at yesterday, 17 of the past 19 days in EUR/USD have been red; but finally, some element of support began to show at a confluent spot on the chart, around the 1.0765 Fibonacci level that was aligned with the bullish trendline originating from last year’s low.
Given the heavy 57.6% allocation of the Euro in the DXY quote, there’s often an inverse relationship playing through the two markets and as that EUR/USD bounce has extended past the 1.0800 handle, DXY has started to pullback.
US Dollar Daily Chart
 Chart prepared by James Stanley; data derived from Tradingview
US Dollar Support Potential
It’s been a stark change-of-pace from the Q3 sell-off in the USD has the currency has quickly retraced more than 61.8% of the 2024 bearish move. There’s only been mild pullbacks along the way, such as the bearish move last Friday after the first re-test of the 200-day moving average, or the stalling shown at 102.55 after the NFP breakout.
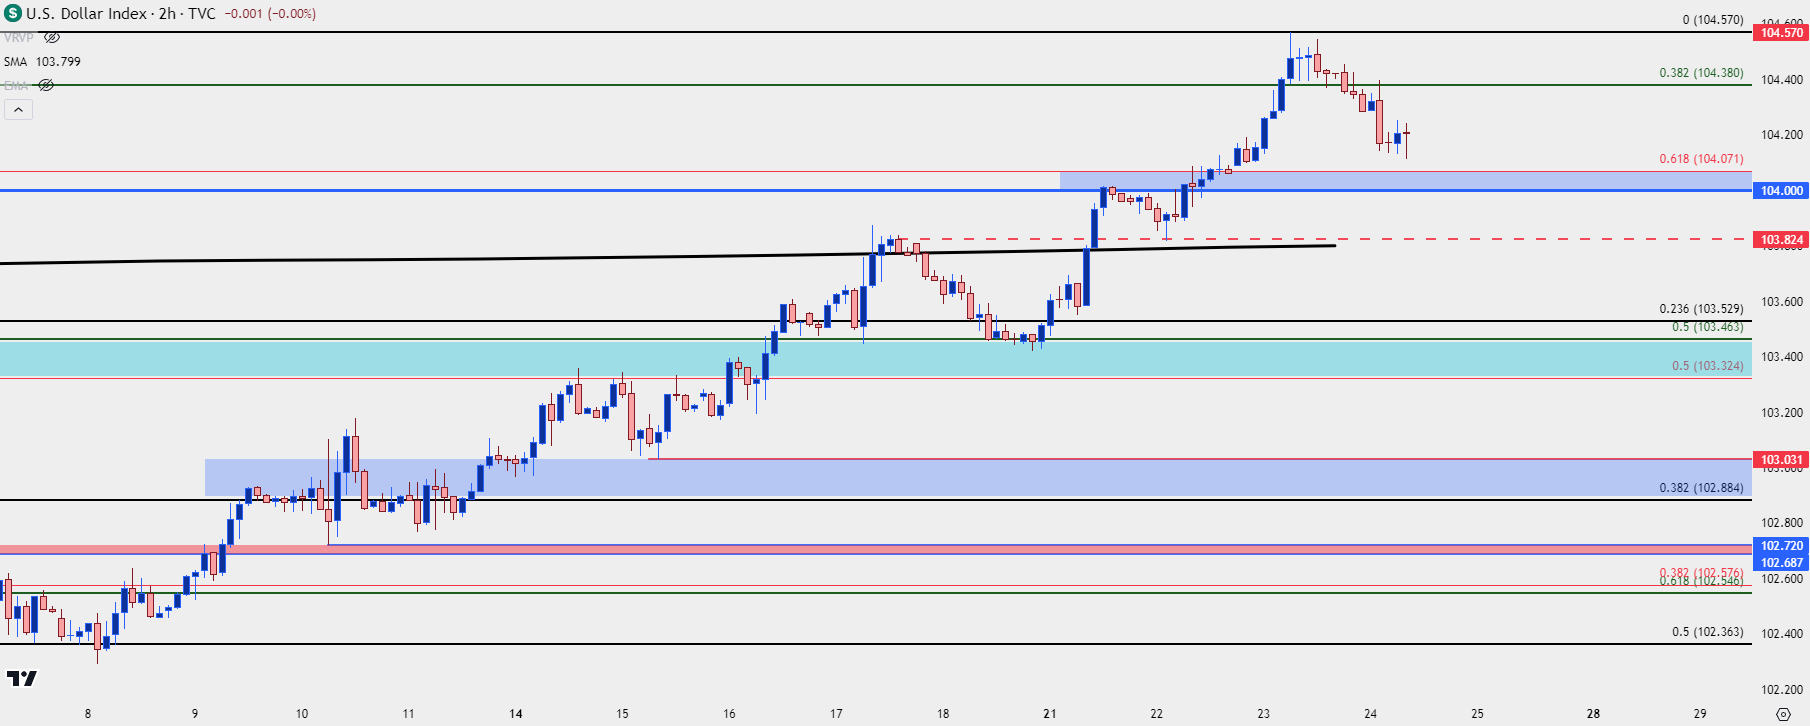
The 23.6% retracement of the rally is all the way down around 103.53, which is a confluent area as there’s quite a few support elements just below that and perhaps coincidentally, it’s the 103.32-103.46 support zone just below that which held the lows after that pullback from the 200-dma. That was support last Friday which held through this week’s open before buyers were able to quickly push up to fresh highs.
But again, the grinding move-higher over the past couple weeks has afforded a number of possible swing areas, and depending on how aggressive bulls remain to be, there could be a case for support around the 104-104.07 area on DXY, and the 103.82 level below is a prior price swing that’s now confluent with the 200-day moving average. In the event of a deeper sell-off, the 102.88-103.03 area is of interest, with that former price functioning as the 38.2% retracement of the Q4 rally.
On the resistance side, it was the 104.50 level that stymied buyers yesterday and above that, there’s quite a bit going on around the 105.00 psychological level, with some nearby Fibonacci retracements. For shorter-term resistance, the 104.38 Fibonacci level helped to hold a short-term lower-high this morning, and that would be the price that I would look for buyers to take out to exhibit a regaining of control in DXY.
US Dollar Two-Hour Price Chart
 Chart prepared by James Stanley; data derived from Tradingview
--- written by James Stanley, Senior Strategist


