US Dollar Outlook: USD/JPY
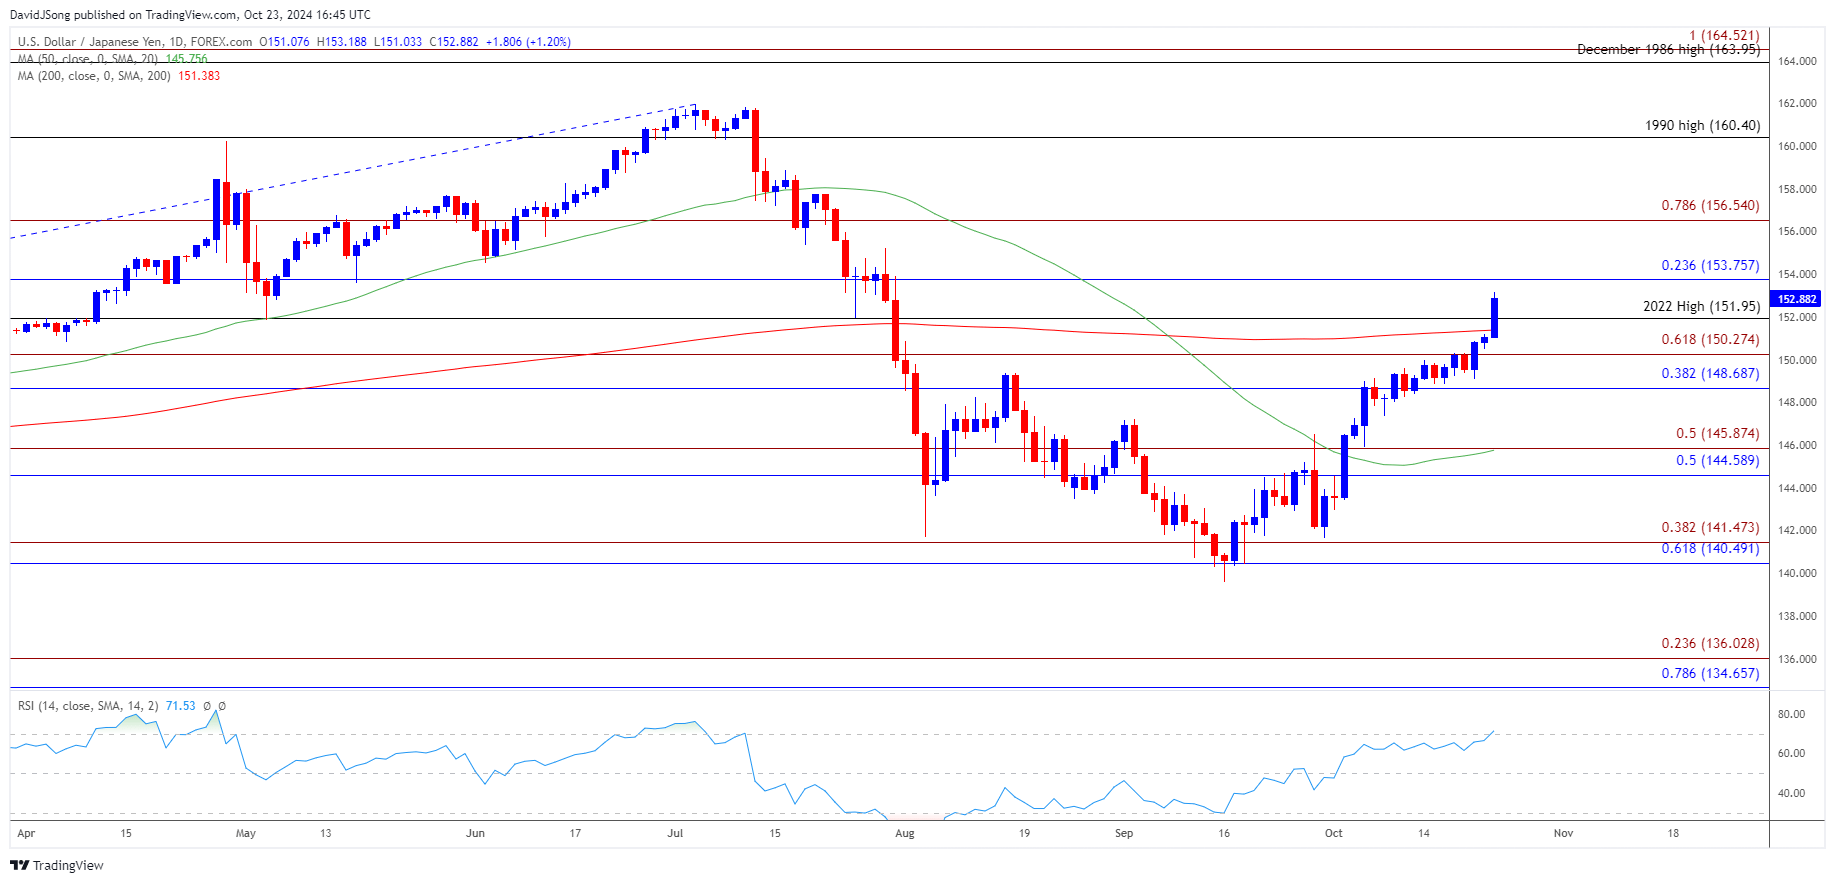
USD/JPY extends the advance from the start of the week to push the Relative Strength Index (RSI) into overbought territory, and the move above 70 in the oscillator is likely to be accompanied by a further advance in the exchange rate like the price action from earlier this year.
US Dollar Forecast: USD/JPY Rally Triggers Overbought RSI Signal
USD/JPY appears to be tracking the rise in US Treasury yields as it climbs to a fresh monthly high (153.19), and the exchange rate may continue to appreciate ahead of the snap election in Japan as the International Monetary Fund (IMF) raises its growth forecast for the US.
Join David Song for the Weekly Fundamental Market Outlook webinar. David provides a market overview and takes questions in real-time. Register Here
It remains to be seen if the Federal Reserve will respond to the fresh updates coming out of the IMF as the central bank moves towards a neutral policy, but there appears to be a growing dissent within the Federal Open Market Committee (FOMC) as the economy shows little signs of an imminent recession.
With that said, waning speculation for another 50bp Fed rate cut may keep USD/JPY afloat, but swings in the carry trade may continue to influence the exchange rate as Chairman Jerome Powell and Co. pursue a neutral policy.
USD/JPY Price Chart – Daily

Chart Prepared by David Song, Strategist; USD/JPY on TradingView
- USD/JPY cleared the August high (148.51) as it carves a series of higher highs and lows, with a break/close above 153.80 (23.6% Fibonacci retracement) opening up 156.50 (78.6% Fibonacci extension).
- Next area of interest comes in around the 1990 high (160.40) but lack of momentum to extend the bullish price series may pull the Relative Strength Index (RSI) back from overbought territory.
- Failure to hold above the 2022 high (151.95) may push USD/JPY back towards 148.70 (38.2% Fibonacci retracement) to 150.30 (61.8% Fibonacci extension) region, with a break/close below the 144.60 (50% Fibonacci retracement) to 145.90 (50% Fibonacci extension) zone opening up the monthly low (142.97).
Additional Market Outlooks
US Dollar Forecast: AUD/USD Falls Toward September Low
Gold Price Breakout Pushes RSI into Overbought Zone
USD/CAD Rally Eyes August High as RSI Pushes into Overbought Zone
British Pound Forecast: GBP/USD Susceptible to Test of September Low
--- Written by David Song, Senior Strategist
Follow on Twitter at @DavidJSong


