US CPI Key Points
- US CPI expectations: 2.6% y/y headline inflation, 3.3% y/y “core” inflation
- The Fed is seen as nearly 50/50 to cut interest rates again in December after Donald Trump and the Republicans secured a “Red Wave” last week
- USD/JPY is on the verge of a breakout to multi-month highs ahead of a likely uptake in inflation.
When is the US CPI Report?
The October CPI report will be released on Wednesday, November 12 at 8:30 ET.
What are the US CPI Report Expectations?
Traders and economists expect the US CPI report to rise to 2.6% y/y on a headline basis, with the “Core” (ex-food and -energy) reading expected tick up to at 3.3% y/y.
US CPI Forecast
Perhaps more than many assumed, US citizens’ dissatisfaction with inflation and the accumulated price increases over the last few years played a big role in Donald Trump’s election victory last week. With the Republican party also winning majority control of the Senate and House of Representatives, slowing the growth in price increases will be a key priority over the next four years.
Of course, this week’s Consumer Price Index (CPI) report relates to price changes in October, and if the leading indicators and economists’ expectations are accurate, it could show an uptick in price pressures from September. Looking at the CME’s FedWatch tool, traders are pricing in about a 50/50 shot of another interest rate cut next month.
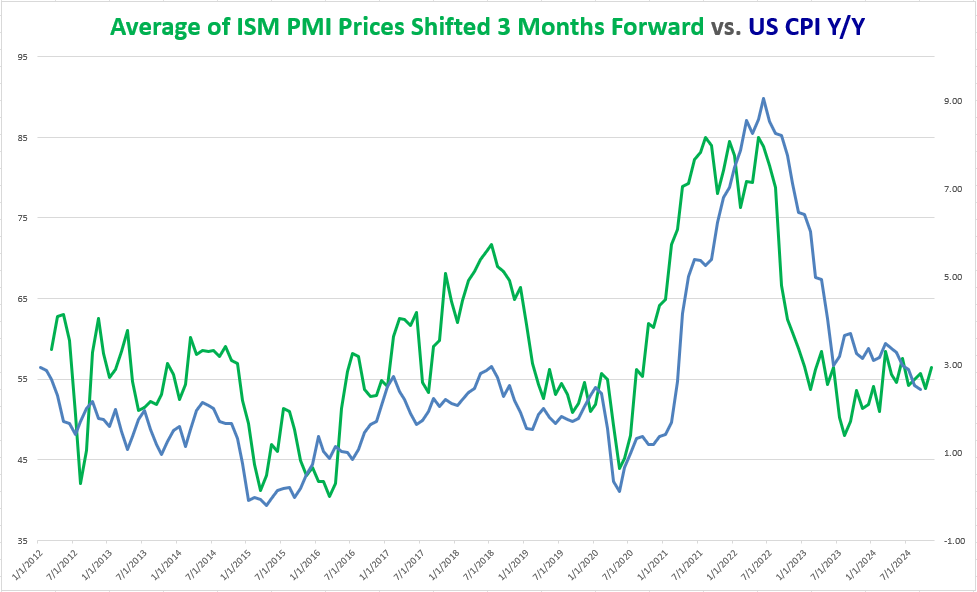
As many readers know, the Fed technically focuses on a different measure of inflation, Core PCE, when setting its policy, but for traders, the CPI report is at least as significant because it’s released weeks earlier. As the chart below shows, the year-over-year measure of US CPI has resumed its decline from the 2022 peak in recent months, though economists are expecting it to bump back up to 2.6% this month:

Source: TradingView, StoneX
As the chart above shows, the “Prices” component of the PMI reports has turned higher over the last month and may continue to rise if another round of tariffs looks likely in the coming weeks.
Crucially, the other key component to watch when it comes to US CPI is the so-called “base effects,” or the influence that the reference period (in this case, 12 months) has on the overall figure. Last October’s 0.0% m/m reading will drop out of the annual calculation after this week’s reading, opening the door for an increase in the headline year-over-year CPI reading as long as the month-over-month reading comes in higher than that.
US Dollar Technical Analysis – USD/JPY Daily Chart

Source: TradingView, StoneX
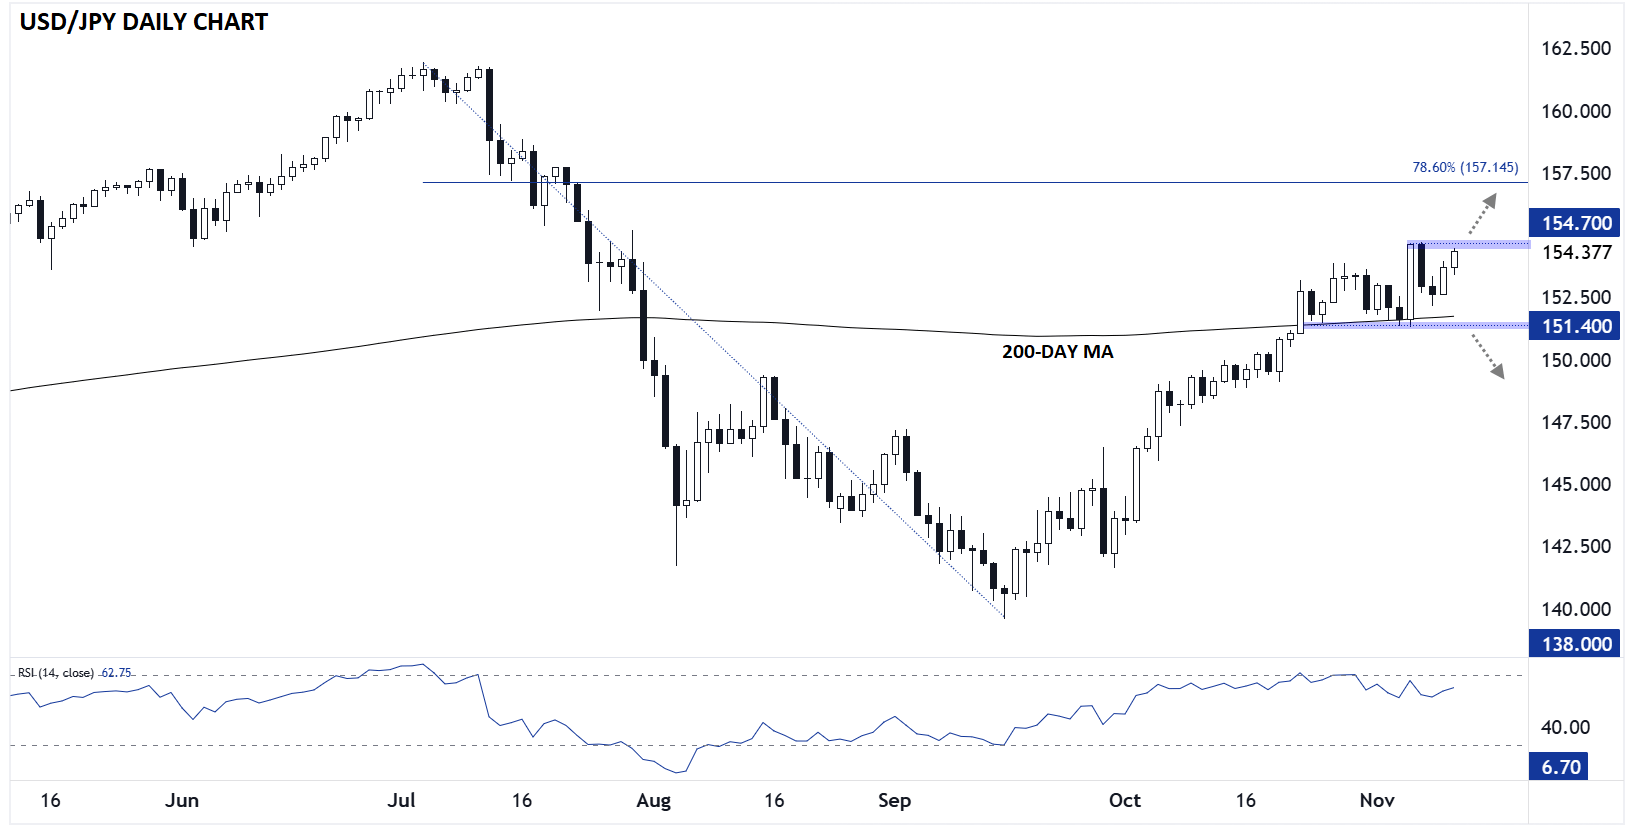
Turning our attention to USD/JPY, the exchange rate is on the verge of a breakout to multi-month highs above 154.70 as of writing. From a purely technical perspective, the pair looks poised for additional gains after consolidating for the past couple of weeks, though bulls would obviously prefer to see a hot inflation reading to add some fundamental heft to that technical outlook. In that scenario, the pair could make a run toward 157.00 next.
Meanwhile, a cool CPI report could take the pair back into the recent 151.40-154.70 range and accordily increase the odds of another rate cut from the Fed next month.
-- Written by Matt Weller, Global Head of Research
Check out Matt’s Daily Market Update videos on YouTube and be sure to follow Matt on Twitter: @MWellerFX


