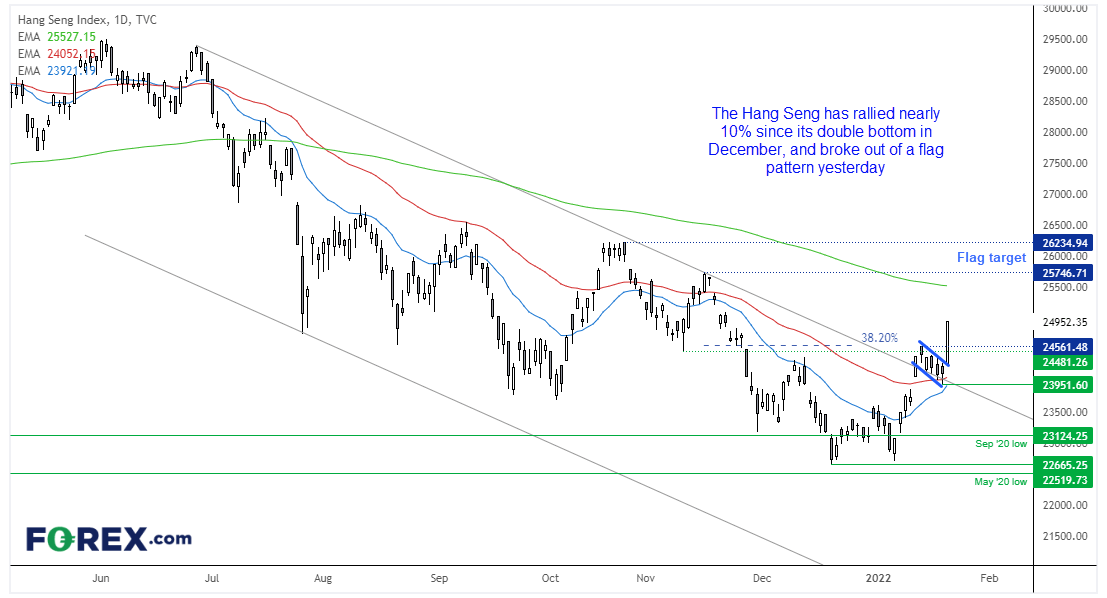
To say the Hang Seng (HSI) responded well to the PBOC’s latest round of easing would be an understatement. Rallying over 3% during its most bullish day in 18months and closing at a 2-month high, it was a top performer in Asia yesterday and looks as though it could have further to go. And a baulk of the heavy lifting over the past two months has been the financial sector, a can be seen on the Financial/Hang Seng ratio which troughed in November. However, as of yesterday’s close the only super sector of the big four to rise was the Commerce and Industries sector. So we’ll keep an eye on that ratio as perhaps the underperformer may now become an outperformer.

The Hang Seng opened at the low of the day and closed at its high to form a full Marabuzo candle. The 50% retracement of its range (called the Marabuzo line) can be used as an approximate support level either for today’s session, or upon any deeper retracement in future. But given the magnitude of yesterday’s rally we are hopeful bulls will retain control to provide a more direct move higher. And it is entirely plausible, given the rally from December’s double-bottom low is broken a bearish channel and its 10-month bear-trend.

Prior to yesterday’s breakout prices had pulled back for five consecutive days along the trendline, meaning it has now broken out form a flag pattern. A measured move of the flag’s mast projects an approximate target around 26,000. Our bias remains bullish above the 23,950 low but if this truly is a flag breakout we wouldn’t really want to see prices trade back below the 24500 highs. But as long as prices hold above 23,950 then the daily trend remains bullish.

As for the Nikkei 225, things don’t look too rosy for the bull camp. The technology-sensitive index has fallen over 7% since the January high and touched a 100-day low yesterday. It is beneath its 200-day eMA, and the 28,690 high respected the 50-day as resistance before prices accelerated lower to confirm a bearish triangle breakout. If successful, the triangle projects a target around 24,500. Although prices need to remain below the lower trendline for the triangle to remain valid.
Ultimately, our bias remains bearish below the 28,700 but this can be refined to 28,000 should momentum force prices lower. As for today, it is expected to gap lower due to the weak lead from Wall Street. The initial downside target is the August low at 26,955, the Dec 2020 low around the 100% Fibonacci extension.
How to trade with FOREX.com
Follow these easy steps to start trading with FOREX.com today:
- Open a Forex.com account, or log in if you’re already a customer.
- Search for the pair you want to trade in our award-winning platform.
- Choose your position and size, and your stop and limit levels.
- Place the trade.


