Silver Talking Points:
- Silver futures failed at 35 and sold off down to 30 last week, but a bounce has since developed that indicates bullish defense of the big figure.
- I looked at silver last week and the second resistance level that I was tracking at 31.26 has already come into play. The question now is whether the bullish momentum can maintain, and I look at that from a few vantage points below.
- Earlier today I looked at gold as a similar recovery theme is showing. Gold has since broken out since that article.
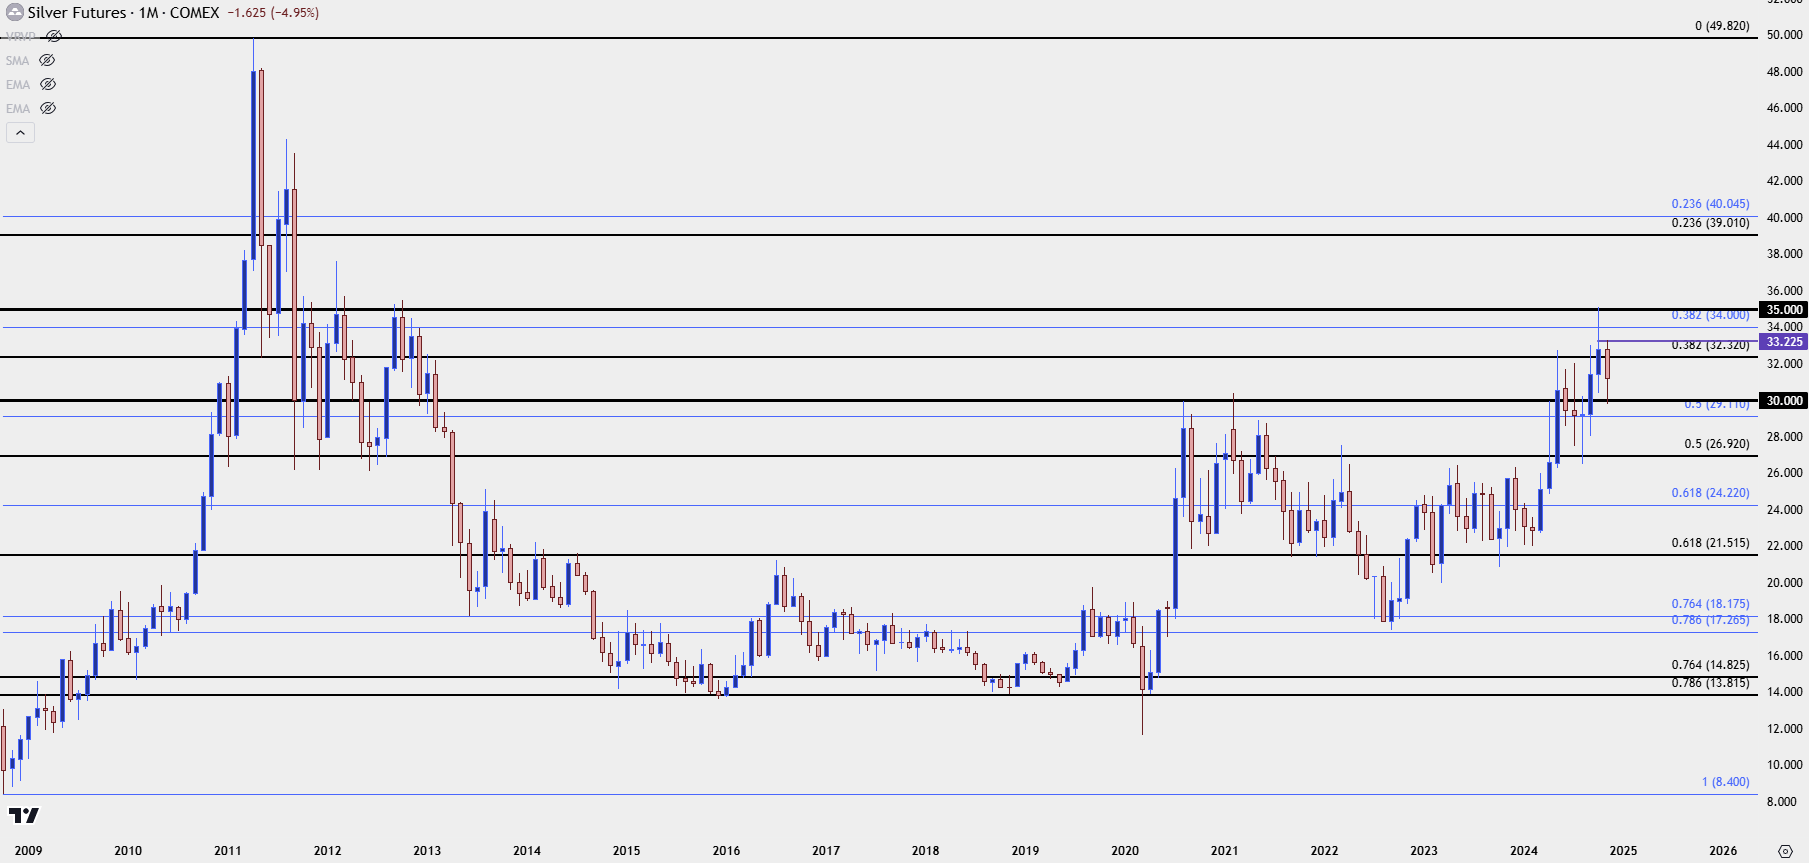
In the immediate aftermath of the Financial Collapse, metals spiked in a massive move. Gold prices jumped up to a fresh all-time-high of 1,920 at the time, and silver went along for the ride, making a fast run but falling just short of the $50/oz level.
It’s what happened after that’s somewhat disconcerting for silver prices. In 2020 as the pandemic was hitting and the Fed was getting uber-dovish again, gold prices broke out and set a new fresh all-time-high, this time crossing the $2,000/oz level. But silver was far calmer, testing but failing to break above the $30/oz level.
Gold then spent the next three-and-a-half years in mean reversion with that $2k level helping to set resistance. Silver, on the other hand, dove back below $20/oz and until 2024, showed as considerably less bullish than gold. And the 30-handle on silver remained a massive spot as bulls tried and failed twice to climb above that level.
Silver Monthly Chart
 Chart prepared by James Stanley; data derived from Tradingview
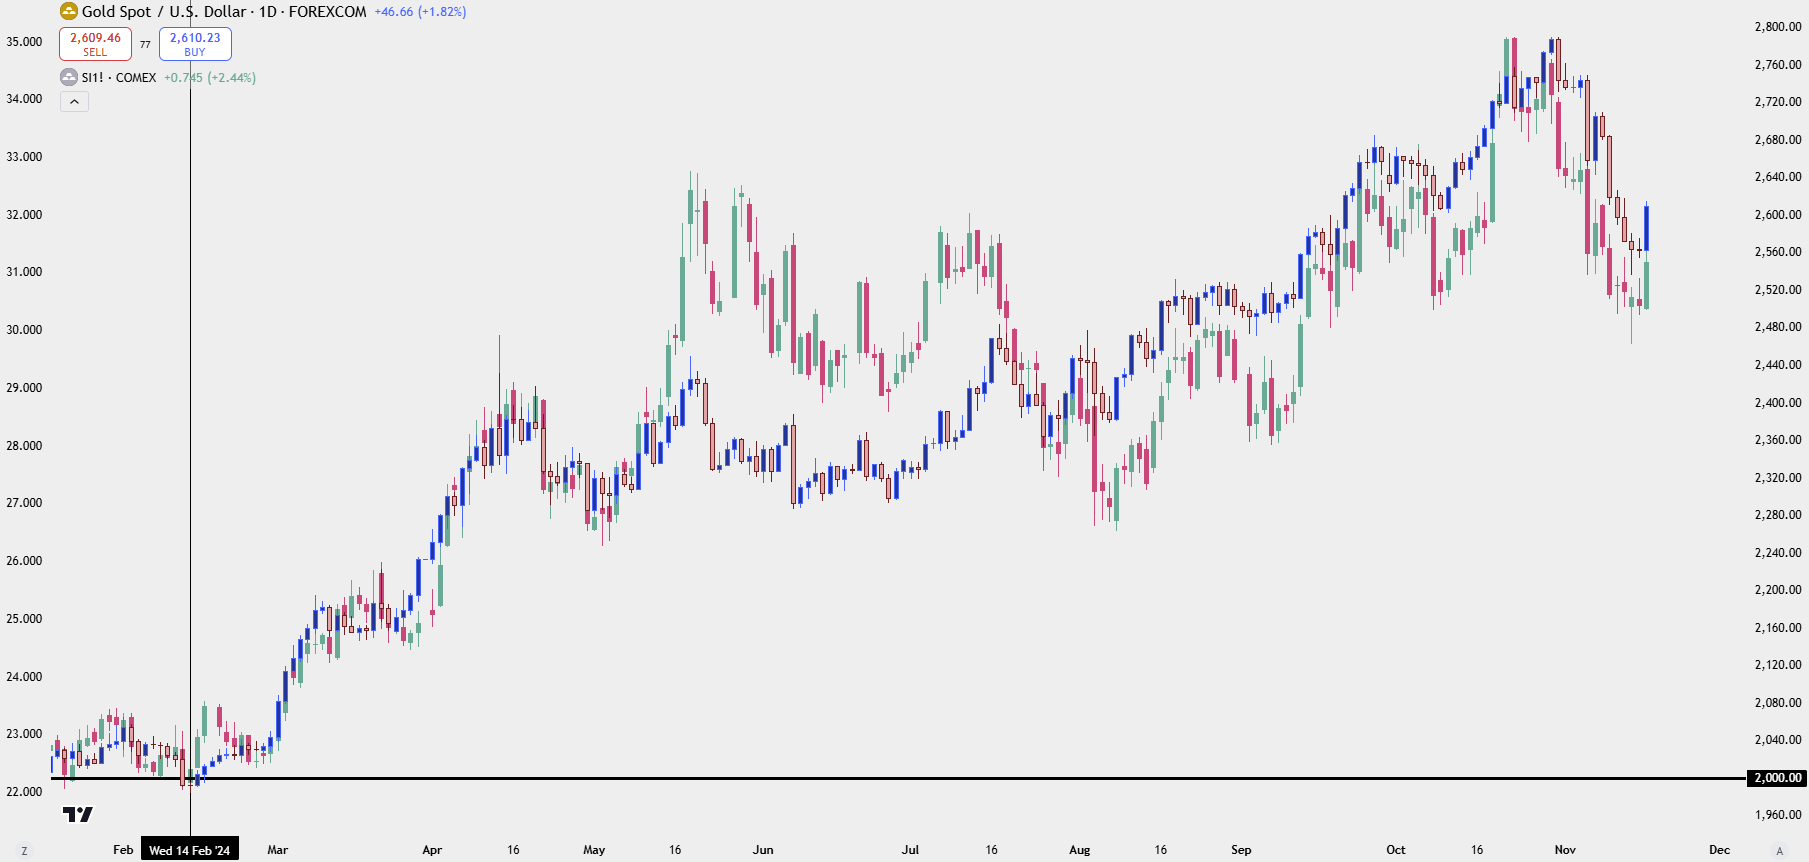
Something shifted earlier this year and this time, it impacted the long side of both metals. It was around February and March that markets started to become convinced that the Fed was going to cut, even if inflation remained well-above target. There was some interesting inter-play in mid-February around the release of CPI and the story is better told around gold. At that point, gold had continued to hover around the same $2,000/oz level that had helped to set resistance for the three years prior. On Tuesday February 13th, a CPI print was released, showing yet another above-expected print for both headline and Core CPI.
Gold pushed back-below the 2k level in a forceful sell-off that day; but a day later, Chicago Fed President implored markets to not get ‘flipped out’ about a single inflation report and the dominos started to fall. The USD weakened and EUR/USD jumped. Stocks caught a strong bid and metals stopped selling-off and started to gain. Gold broke out above the $2k level a day later and hasn’t traded below that price since. What followed after that was a massive bullish run-in gold prices that didn’t really calm, save for a few pullbacks, until the November open.
In silver, matters were a bit messier but from the chart below you can see where there was similar impact, albeit in less consistent fashion.
Silver and Gold Prices Since Early-2024 Trade
 Chart prepared by James Stanley; data derived from Tradingview
Silver Shorter-Term
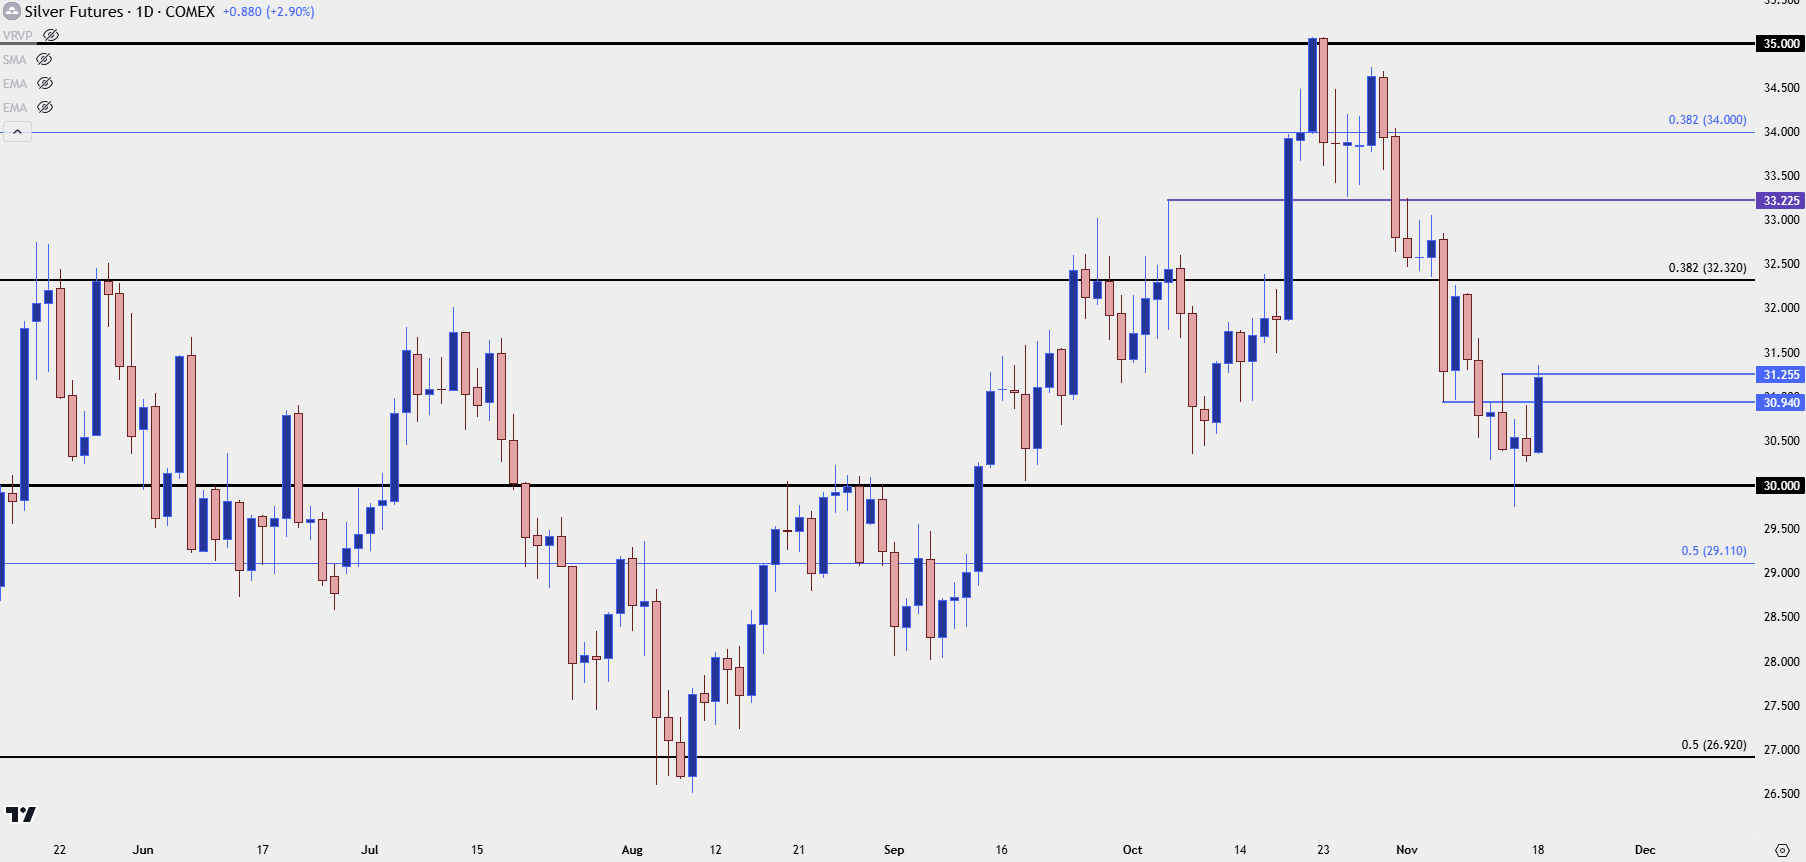
At this point, silver prices still haven’t taken out the 2011 high while gold prices are far beyond that point; but shorter-term price action in silver has been quite bullish and that led to last month’s test of the $35 level as the metal set a fresh 12-year high. The reaction to that was brutal, with sellers showing up to close that weekly candle as a doji, and the weakness that followed the following week confirmed an evening star pattern.
That led to two more weeks of selling until last week’s test of the $30/oz level that, so far, has led to a bounce. I looked at levels plotted at 30.94 and 31.26, and as I wrote then ‘if bulls can push through that in early-trade next week, then the prospect of bullish continuation could come back into the picture with a bit more confidence.’
Well, that is the situation that we now have as both resistance levels have been tested through.
Silver Daily Price Chart
 Chart prepared by James Stanley; data derived from Tradingview
Silver Strategy
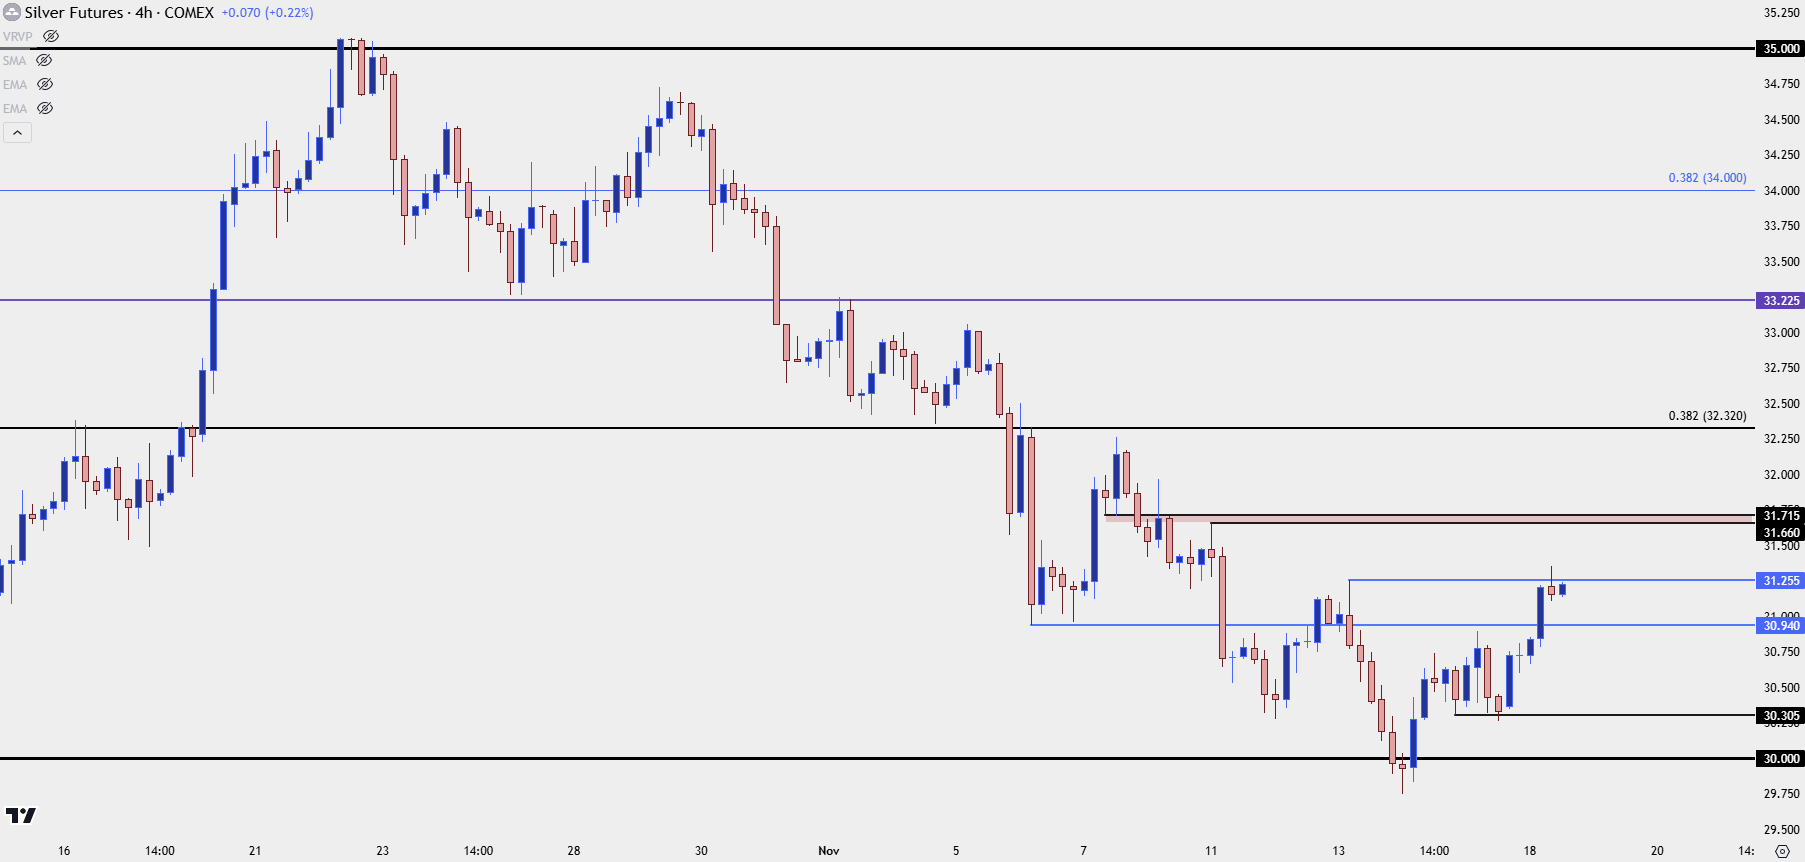
Now that bulls have pushed up to a short-term higher-high, they have to maintain the move and ideally this would come with continued higher-lows to go along with higher-highs. Last Friday’s higher-low printed at 30.31 and the 30.94 level remains notable, as well; and if buyers can hold any pullbacks above that level, the door remains open for bullish continuation.
For next resistance overhead, it’s the 32.32 Fibonacci level that sticks out as important, and there’s a shorter-term zone from around 31.66 up to 31.72.
Silver Four-Hour Chart
 Chart prepared by James Stanley; data derived from Tradingview
--- written by James Stanley, Senior Strategist


