Salesforce (CRM) Q3 2024 Earnings Preview
Earnings Release Date: December 3, 2024 (Aftermarket)
Consensus EPS: $2.43 (+15.17% YoY)
Consensus Revenue: $9.35 billion (+7.2% YoY)
Salesforce is set to report its Q3 2024 earnings on December 3, with expectations of strong growth in both earnings and revenue. If achieved, this would represent a continuation of Salesforce's positive momentum, following eight consecutive earnings beats and six revenue beats in its last eight releases.
Key Highlights
Performance Metrics
- EPS Growth: A forecasted 15.17% increase in EPS reflects strong operational efficiency and potential profit margin improvements.
- Revenue Growth: A 7.2% YoY rise to $9.35 billion aligns with Salesforce’s recent growth trajectory, driven by robust performance across its subscription and support revenue streams.
Recent Results and Strategic Investments
- Q2 Performance: In Q2, Salesforce reported an 8% sales increase and a 9% rise in subscription and support revenues, highlighting the strength of its core business.
- AI Integration: Salesforce has been heavily investing in autonomous AI agents, integrating these technologies into its customer management, service, and marketing products. With 1.9 trillion weekly AI transactions via Model Builder and 83.2 billion weekly workflows through Flow Builder, the company’s AI-driven Data Cloud remains a key growth driver.
- Acquisitions: Salesforce acquired Zoomin and Own Company for $1.9 billion, highlighting its strategy of expanding capabilities in customer management and automation.
- Hiring Push: The plan to hire 1,000 new employees for Agentforce reflects Salesforce’s focus on scaling its sales and AI capabilities.
Key Questions and Concerns
- AI Profitability: While Salesforce’s AI initiatives have boosted growth, investors are keen to see whether these investments will affect profit margin expansion.
- Management Changes: Analysts will watch for CEO Marc Benioff’s commentary on:
- The planned departure of the CFO.
- The head of AI research leaving for Meta Platforms, which raises questions about leadership in a key growth area.
Takeaways
Positives:
- Strong momentum in AI integration and customer management solutions.
- Consistent earnings and revenue beats, reflecting robust financial performance.
- Recent acquisitions and product expansions signal long-term growth potential.
Concerns:
- Heavy AI investments might crimp profit margins in the near term.
- Leadership transitions could create uncertainty in critical growth segments.
- Slower subscription and support revenue growth could weigh on future top-line performance.
Salesforce Inc. (CRM) Technical Analysis – 1 Day chart
Stock Performance
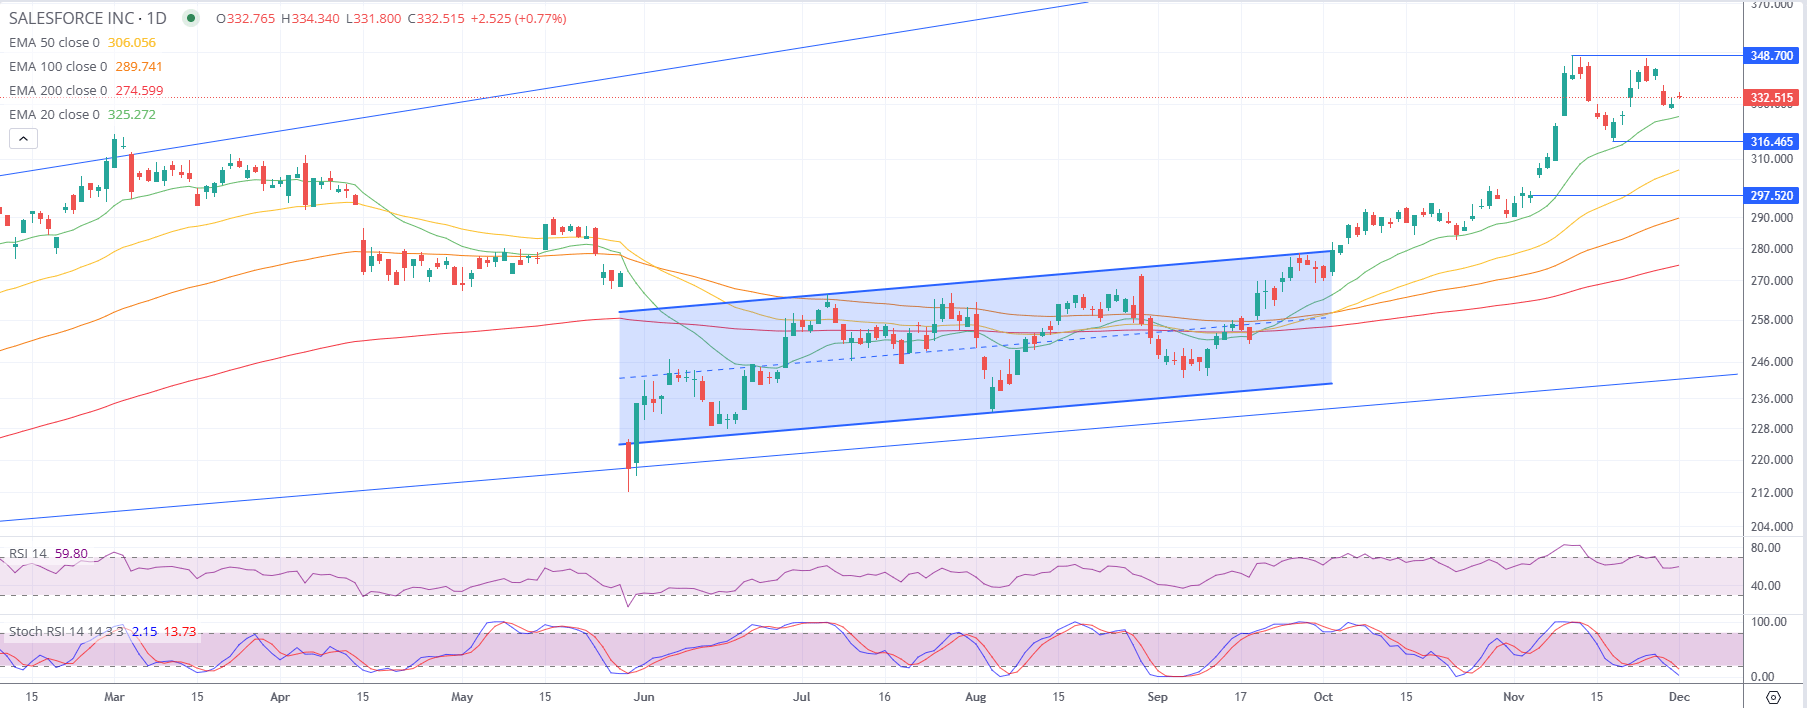
Salesforce shares have surged 17.75% over the past month, significantly outperforming the Computer and Technology sector (+0.27%) and the S&P 500 (+2.1%). The stock is up 32% since its last earnings release, buoyed by optimism around its Agentforce initiative.

1. Current Price Action and Trend:
- Salesforce is trading at $332.52, showing a slight pullback from its recent high of $348.70.
- The stock remains in a strong uptrend, supported by rising moving averages and a bullish channel pattern.
2. Support and Resistance Levels:
- Resistance:
- Immediate resistance lies at $348.70, the recent high. A breakout above this level would signal a continuation of the bullish trend.
- Beyond that, the next target is $360, a psychological resistance zone.
- Support:
- The first support level is at $316.46, which aligns with the EMA 20 and has acted as a dynamic support level during the recent rally.
- Further support is at $297.52, where the EMA 50 resides, providing a robust medium-term base.
- The lower boundary of the previous consolidation range near $275 offers additional support if a deeper pullback occurs.
3. Moving Averages:
- The stock is trading above all key moving averages:
- EMA 20 at $325.27 acts as immediate support.
- EMA 50 at $306.06 reinforces the bullish trend.
- EMA 100 at $289.74 and EMA 200 at $274.59 confirm long-term bullish strength.
4. RSI and Stochastic RSI:
- The RSI is at 59.80, reflecting neutral-to-slightly bullish momentum with room for further upside before hitting overbought conditions.
- The Stochastic RSI is at 13.73, indicating oversold conditions. This suggests a potential short-term bounce from current levels.
5. Bullish Channel Pattern:
- Salesforce is trading within a well-defined bullish channel, with the lower boundary near $316 and the upper boundary extending toward $360.
- The recent pullback to $332 suggests the stock is consolidating before potentially resuming its upward trend.
Thesis:
Scenario 1: Bullish Continuation:
- If Salesforce breaks above $348.70, it could target the next resistance at $360.
- Sustained bullish momentum above $360 would open the door for further upside within the bullish channel.
Scenario 2: Short-term Pullback:
- If the stock fails to hold above $316.46, a deeper pullback to $297.52 (EMA 50) is possible.
- A breakdown below $297.52 would signal a shift in sentiment, with further downside potential toward the lower boundary of the bullish channel at $275.
Conclusions
Salesforce’s Q3 earnings are expected to highlight its strong operational execution, particularly in AI-driven initiatives and customer management solutions. However, investors will closely monitor profit margins, leadership changes, and CEO Marc Benioff’s strategic outlook to gauge how Salesforce balances growth with efficiency. With shares up significantly year-to-date, a strong earnings report could further solidify Salesforce’s position as a leader in the tech sector, though challenges around profitability and leadership transitions remain areas to watch.
Technically Salesforce remains in a strong uptrend, with resistance at $348.70 and support at $316.46. The Stochastic RSI suggests a short-term bounce, while the broader trend points to continued upside toward $360. A failure to hold $316.46 could lead to a pullback toward $297.52 or lower.


