- S&P 500 forecast: Rising VIX signals investor caution amid US election and earnings season
- Disappointing results from Meta and Microsoft weigh on sentiment; Apple and Amazon are set to report after the bell
- S&P 500 breaks a key short-term trend line, pacing way for technical selling
US equities have fallen at the start of today’s US session, following on the losses from the previous day and weaker global markets. The tech sector is in the spotlight following underwhelming earnings reports from Meta and Microsoft, with the latter falling in excess of 5% shortly after the open. Apple and Amazon are also set to report their results later today, while investors brace for key US macro data, including non-farm payrolls and ISM services PMI to round out the week. With the US election just around the corner, many investors are adopting a more cautious stance, sparking speculation of a much-anticipated correction in the S&P 500 forecast. This week’s price action suggests investors are taking a wait-and-see approach until post-election, proving bearish traders an opportunity to finally show their presence.
Global market mood sours
European markets have been drifting lower in recent days and continued their falls today. In Asia, APAC markets struggled to gain ground after a weaker US session, with sentiment dampened by mixed data from China’s PMI. Meanwhile, the Bank of Japan, in line with expectations, held rates steady and avoided giving any new policy hints, leading to little movement in Asian stocks. The weaker European market sentiment followed the release of stronger-than-expected Eurozone GDP growth and CPI inflation, complicating hopes for an aggressive rate cut from the ECB. Luxury stocks were notably under pressure, with names like Moncler and LVMH seeing declines.
Tech earnings and volatility on the rise
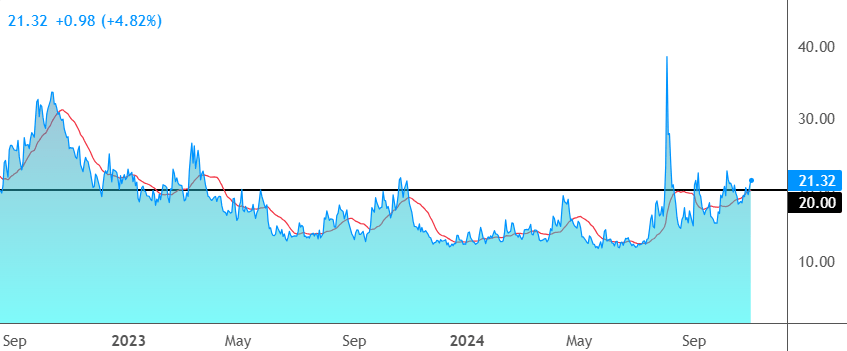
Amid rising market uncertainty, the VIX volatility index has climbed to 21.85, marking a sharp increase in percentage terms if not nominal terms. Anyway, rising VIX underscores investor caution ahead of next week’s US election and key economic data releases. Today’s economic calendar included jobless claims and PCE inflation figures, both failing to provide any immediate market reaction, with more consequential non-farm payrolls and ISM services data to come on Friday. Elevated options activity around stocks like AMD and Alphabet suggests growing anticipation for earnings results, with Apple and Amazon set to play a pivotal role in the S&P 500 forecast. Both Microsoft and Meta exceeded revenue expectations but saw declines in their shares; Microsoft’s 5% plus losses were attributed to slower-than-expected Azure growth, while Meta’s dip stemmed from higher-than-expected AI investment.

US Presidential election market implications
The upcoming election is casting a shadow over market sentiment, as recent polls suggest a potential Republican victory. Investors are considering how such an outcome might impact fiscal policy, with some expecting increased spending and tax cuts that could exacerbate inflation pressures. Additionally, the prospect of higher tariffs could impact European and Chinese assets, adding complexity to the global trading environment. These factors have contributed to one of the roughest months for Treasuries this year, with the 10-year yield trending around 4.33%. Rising yields will not go unnoticed and may increase market pressure amid the potential for a fiscally expansive government post-election, at a time when deficit spending is already at an alarming rate.
Technical S&P 500 forecast: Key levels to watch

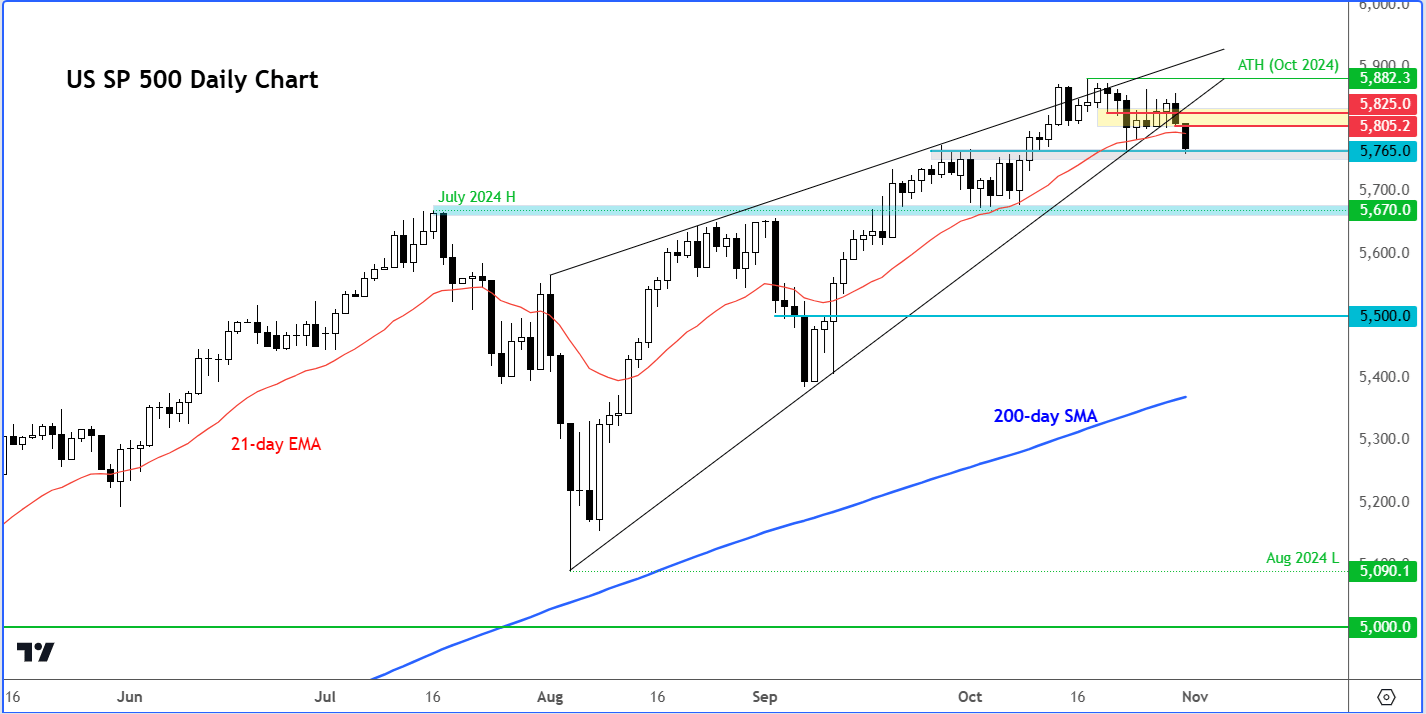
In technical terms, the S&P 500 has broken below a key trend line of a wedge pattern that has held since the market’s last bottom in August. This breakdown indicates a bearish turn in the S&P 500 forecast, with support now being tested around the 5765 level. Should this level break decisively, a more significant drop could test July’s high at 5670, or thereabouts. A decisive close below that point may further open the way to steeper losses, but we will cross that bridge if and when we get there. Conversely, a break back above the 5805-5825 resistance area would invalidate this bearish outlook, signalling the resumption of bullish momentum.
Overall, the S&P 500 forecast shows heightened short-term downside risks due to the looming election and the trendline break, though this does not imply the long-term bull market is over. With key economic data still pending, a cautious stance may be wise, balancing technical and fundamental indicators until more clarity emerges.
Source for all charts used in this article: TradingView.com
-- Written by Fawad Razaqzada, Market Analyst
Follow Fawad on Twitter @Trader_F_R


