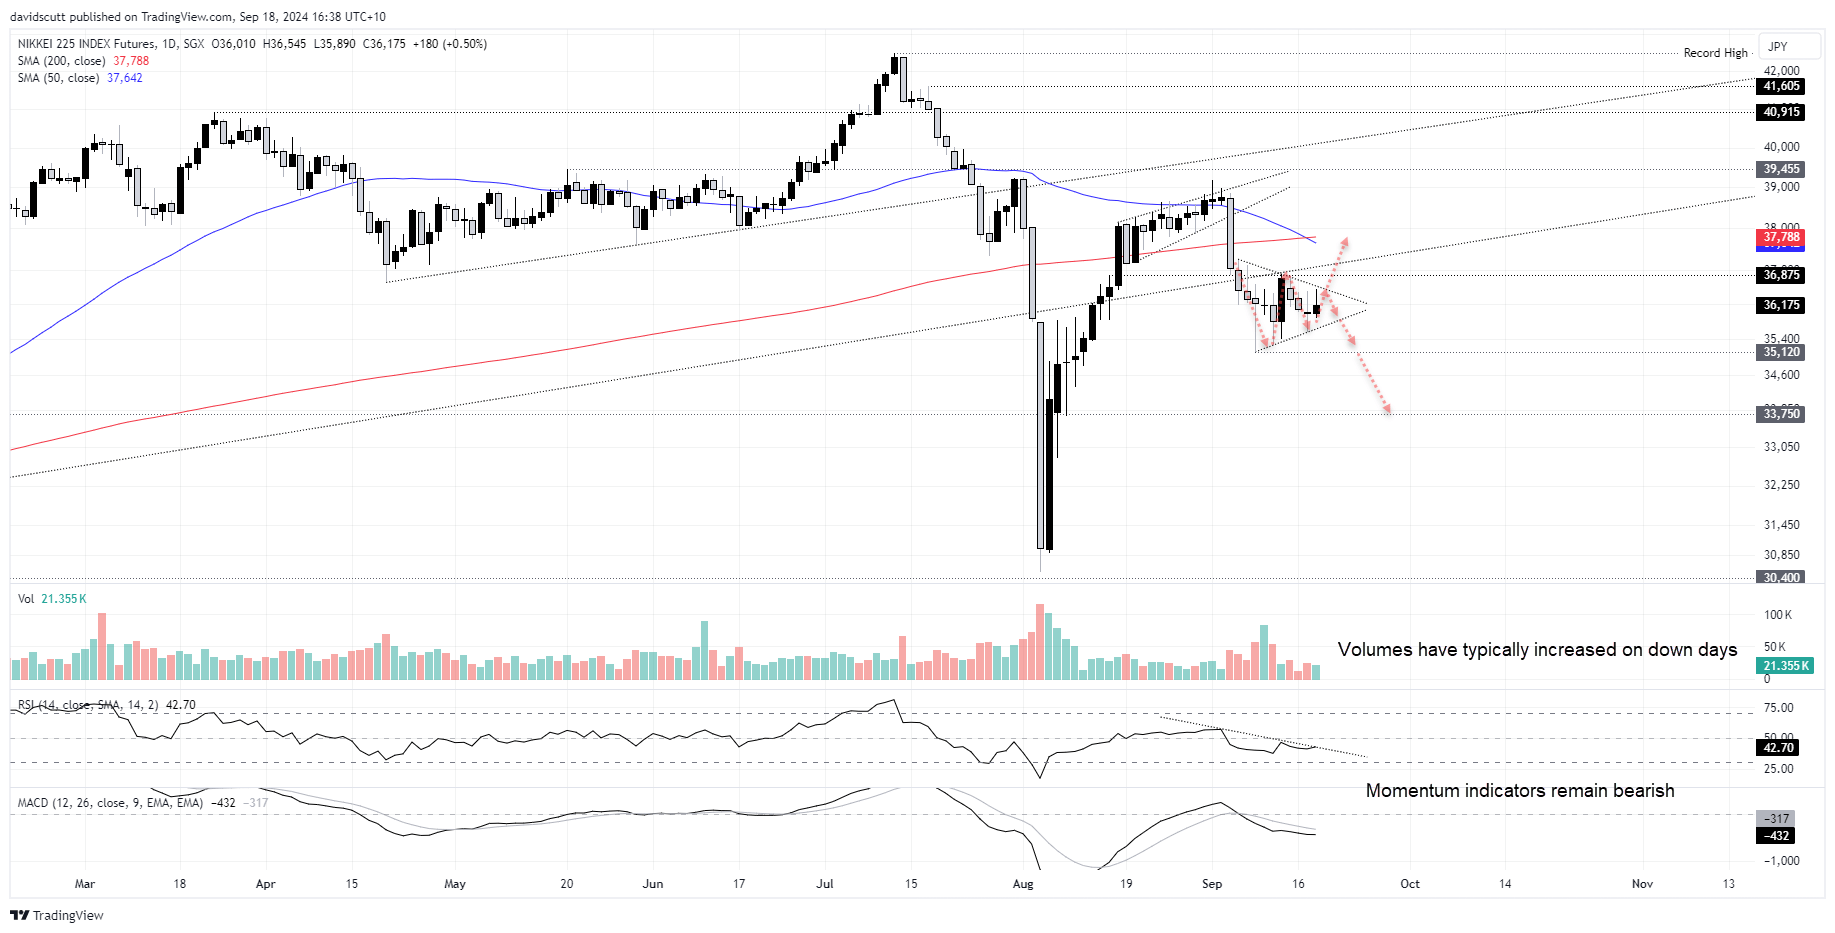
- Price action in Nikkei 225 futures tells a tale of battling bulls and bears
- Downside risks look more apparent given momentum, volume signals
- On alert for a breakout as price coils in ever narrowing range
- Nikkei 225 has been strongly correlated with USD/JPY movements recently
A battle is underway
Nikkei futures look like a market where bulls and bears are waging war, all while the price continues to coil up within a symmetrical triangle, waiting for a potential explosive break.
The sizeable wicks on the daily candles suggests the collective market hasn’t made up its mind yet, although having entered the triangle from above, the inclination is that directional risks are biased lower. It’s also noteworthy that down days are often accompanied by stronger volumes, suggesting bears marginally have the upper hand. RSI (14) and MACD continue to generate bearish signals on momentum.
Fed interpretation important
While I see more downside risk than upside, I’m not wedded to the view. Depending on what the Fed does with interest rates, and the subsequent reaction in the Japanese yen, the picture could easily change. My gut feel is the yen will be more influential on Japanese stocks than the lead from Wall Street, so that will help determine the higher probability setup.
A 50-pointer from the Fed would likely create downside pressure on USD/JPY, amplifying headwinds for the Nikkei. A 25-pointer would likely do the opposite. Over the past four weeks, Nikkei futures have had a correlation coefficient score with USD/JPY of 0.85 on a daily timeframe.
Trade ideas

If we see a downside break of the triangle, 35120 is the first level of note. Below that, 33750 has been respected on numerous occasions in recent years, making that a potential target.
If we were to see the price break out of the triangle on the topside, 36875 has acted as both support and resistance recently. Beyond that, the former uptrend will provide a test with a break above that opening the door for a potential move to the 50 and 200-day moving averages.
-- Written by David Scutt
Follow David on Twitter @scutty


