- Gold reclaims uptrend; buying dips preferred
- Silver squeezes higher but faces near-term headwinds
- Correlations with US yields, dollar stay strong
- Quiet US calendar supports near-term momentum
Overview
The bounce in gold and silver prices we were expecting has materialised, helped along by a quiet US calendar that has capped the relentless rise in US Treasury yields. While some headlines suggest safe-haven flows may have driven the rebound, a quick glance at the charts shows the move was well underway before the latest concerns surrounding the Ukraine conflict emerged.
Now that we’ve seen the corrective bounce, this note will examine potential setups to determine whether to cut, hold, reverse, or add positions.
Gold reclaims uptrend; buying dips preferred
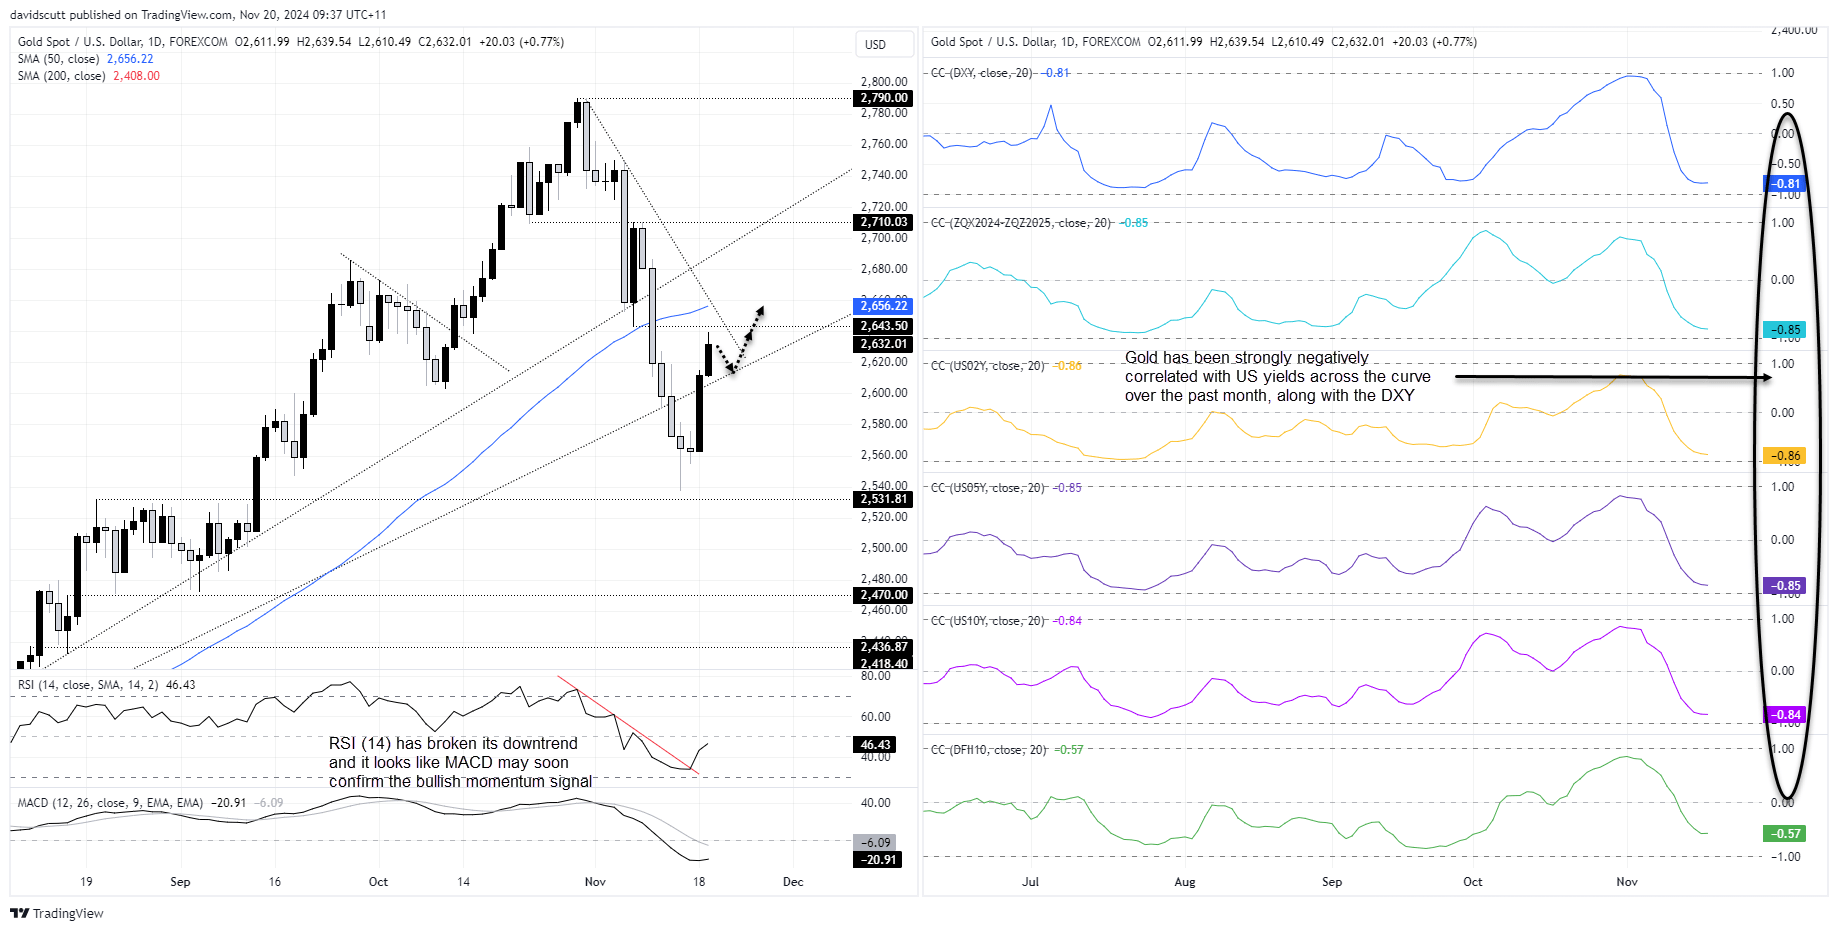
Gold has been driven largely by movements in US interest rates and the dollar over the past month, reaffirming the relationship seen in the months prior to the Federal Reserve’s tightening cycle began in September.
Correlation coefficients over this period highlight the tight inverse relationship, whether Fed rate cut pricing by the end of 2025, or US two-, five-, and ten-year Treasury yields, with scores between -0.84 and -0.86. Similarly, the correlation with the US dollar has been nearly as strong, sitting at -0.81. Over the past month, gold has consistently done the opposite of yields and the dollar.
With the US economic calendar thinning out and US rates having already sold off heavily in response to strong economic data and Donald Trump’s presidential victory, it’s no surprise gold found its footing as the economic calendar tailed off. There have been no fresh catalysts to drive another leg higher in either yields or the dollar.

Source: TradingView
The original hammer candle that sparked interest in a long setup turned out to be the start of a morning star pattern, which ultimately delivered the squeeze we were looking for. RSI (14) has broken its downtrend, and MACD appears close to confirming a bullish momentum signal, suggesting there may be further upside in the near-term.
The price has forced its way back into the uptrend it was following prior to last week’s bearish break. That trendline may now act as support, providing a decent bullish setup. Pullbacks towards the uptrend allow for longs to be established above it, with stops beneath for protection.
If the uptrend is breached again, the bullish bias would be scuppered, creating fresh opportunities to look for bearish setups.
On the topside, $2643.50 should be on the radar, as should the intersection of the 50-day moving average with the downtrend running from the record highs. It’s found around $2658 today. If that were to be give way, the uptrend dating back to early August may provide some resistance given it acted as support on multiple occasions earlier in the year. It’s located at $2690 today.
Silver squeeze halted, for now
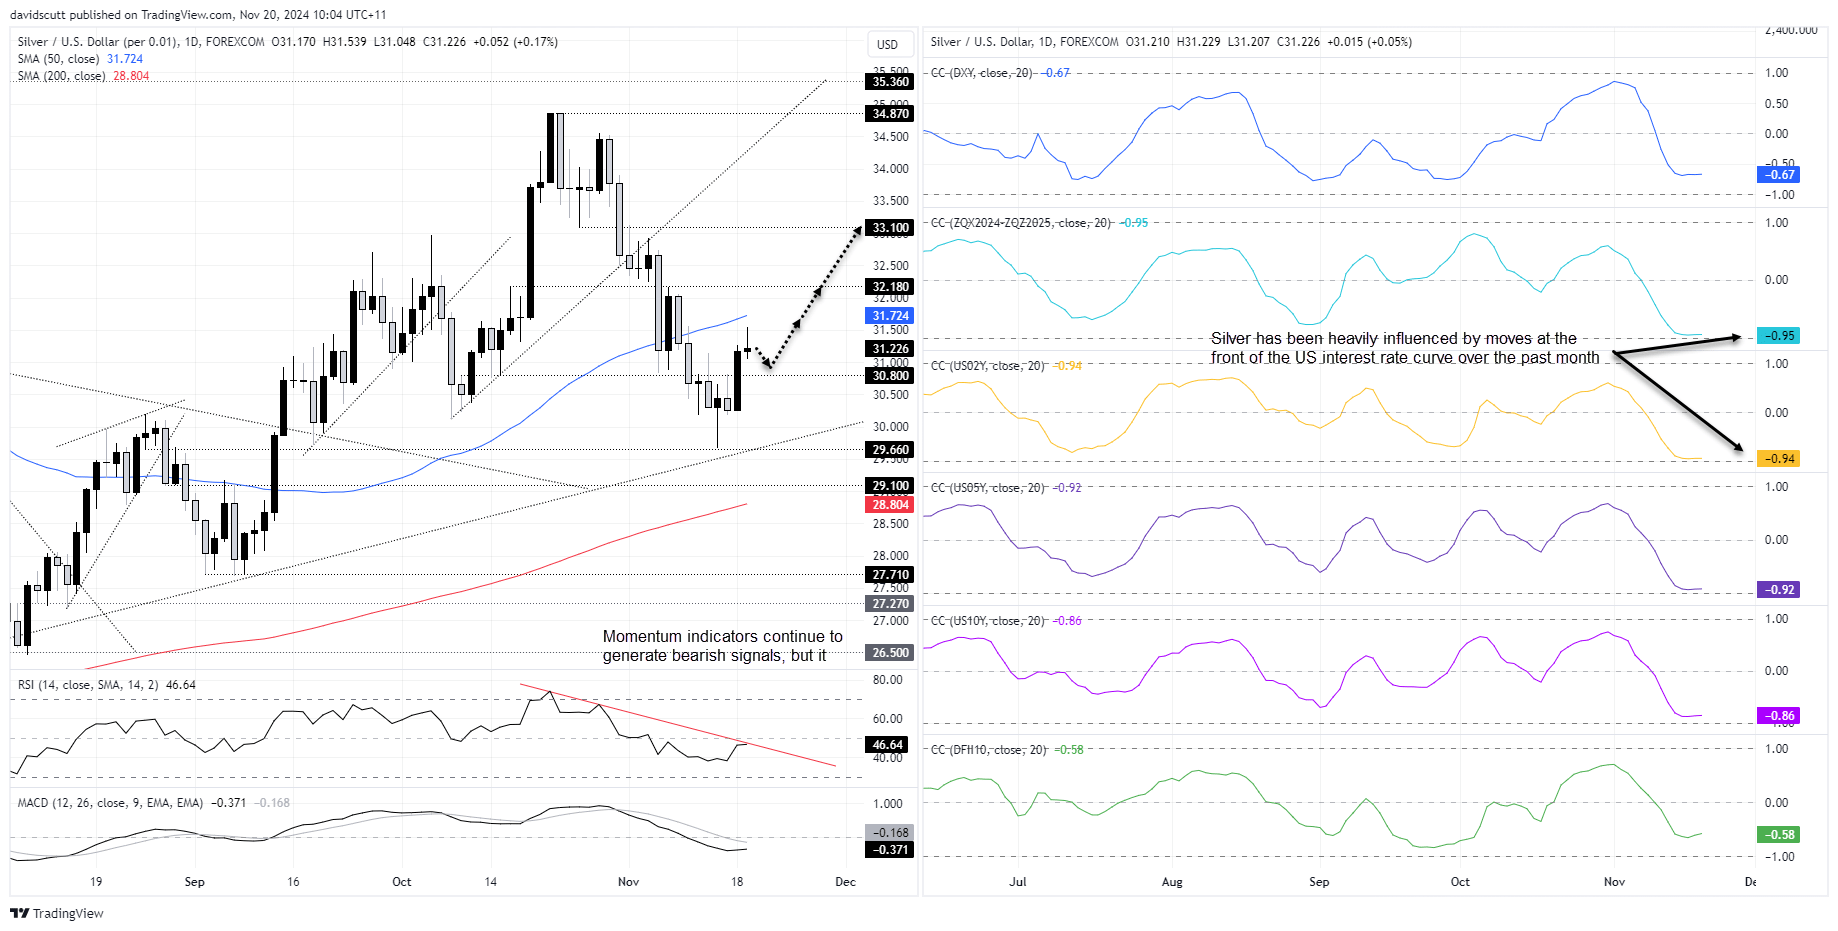
Compared to gold, silver’s technical picture offers a less compelling case for upside. Tuesday’s bullish pin wasn’t a strong signal for bulls, particularly as RSI (14) continues to trend lower and MACD remains in bearish territory. However, the momentum picture may be in the early stages of turning, reinforcing the need for patience.

Source: TradingView
One key level to watch on the downside is $30.80, which has acted as both support and resistance multiple times in recent weeks. Aside from one false bullish break, the price has respected this level. Pullbacks towards the level generate a bullish setup, allowing for longs to be established above it with stops below for protection.
The 50-day moving average would be the initial target, with $32.18 and $33.10 the next after that. If $30.80 is breached on a closing basis, the bullish bias would be invalidated.
As with gold, silver has been highly negatively correlated with US interest rates, particularly at the front end of the curve. The correlation with end-2025 Fed rate cut pricing and US two-year Treasury yields is almost perfect, sitting at -0.95 and -0.94 respectively.
Assessing risk events
Known risk events that could meaningfully shift the US interest rate outlook are few and far between over the next two weeks. The calendar does include the release of the core PCE deflator – the Fed’s preferred inflation gauge – and the second reading of Q3 US GDP, but recent history suggests neither is likely to generate major surprises or significant market moves. It’s all about the labour market and inflation readings released earlier in the month.
Geopolitics remains an ever-present risk, but in the absence of a meaningful escalation in Ukraine or the Middle East, dips driven by headlines are likely to be bought in the near term.
-- Written by David Scutt
Follow David on Twitter @scutty


