Gold Technical Outlook: XAU/USD Short-term Trade Levels
- Gold prices plunge nearly 5% as Trump secures second term
- XAU/USD threatens August uptrend- testing support ahead of Fed rate decision
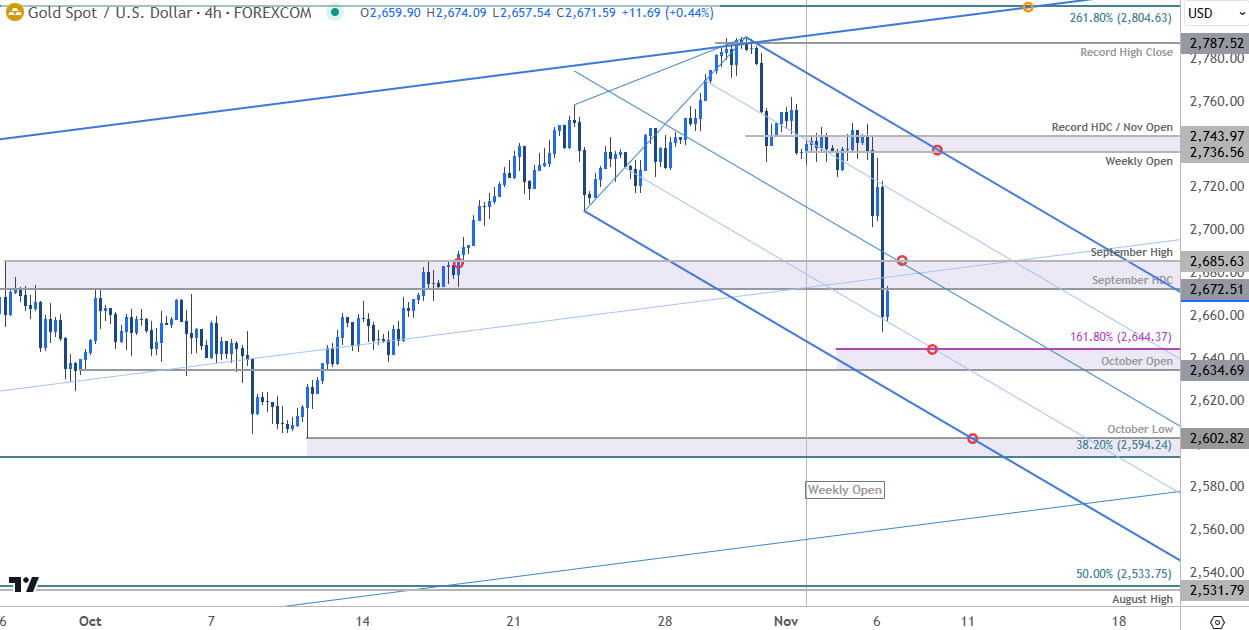
- Resistance 2672/85, 2736/44 (key), 2787-2804- Support 2634/44, 2594-2602 (key), 2532/33
Gold prices have fallen nearly 2.8% since the start of the week with the election sell-off intensifying today in New York. The decline takes XAU/USD below a key pivot zone and the focus is on today’s close as the bears threaten a deeper correction within the broader uptrend. Battle lines drawn on the XAU/USD short-term technical charts ahead of tomorrow’s FOMC interest rate decision.
Review my latest Weekly Strategy Webinar for an in-depth breakdown of this gold technical setup and more. Join live on Monday’s at 8:30am EST.Gold Price Chart – XAU/USD Daily

Chart Prepared by Michael Boutros, Sr. Technical Strategist; XAU/USD on TradingView
Technical Outlook: In last month’s Gold Short-term Price Outlook we noted that XAU/USD had, “Gold has set the October opening-range just below resistance at the record high-day close. The immediate focus is on a breakout of the weekly opening-range for guidance here with the immediate advance vulnerable sub-2672.” Gold ripped higher two-day later with the rally extending 8.5% off the October lows to register fresh record highs.
The advance exhausted into confluent uptrend resistance into the close of the month with gold turning sharply lower last-night as Donal Trump secured the US presidential election. The decline is now attempting to break confluent support at the September high-day close (HDC) / September high around 2672/85- note that the August channel (red) and the 75% parallel (blue) converge on his region and the immediate focus is on today’s close with respect to this zone. All eyes now fall on the Fed.
Gold Price Chart – XAU/USD 240min

Chart Prepared by Michael Boutros, Sr. Technical Strategist; XAU/USD on TradingView
Notes: A closer look at gold price action shows XAU/USD trading within the confines of a proposed descending pitchfork extending off the October high. The 25% parallel caught today’s decline with price now testing 2672/85 as resistance- watch today’s close.
Initial support now eyed at the October open / 1.618% extension of the recent decline at 2634/44 with a more significant confluence zone seen just lower at 2594-2602- a region defined by the 38.2% retracement of the May advance & the October swing low and an area of interest for possible downside exhaustion / price inflection IF reached.
A breach above the median-line would threaten a test of the upper parallel with near-term bearish invalidation now set tot the objective weekly open / record HDC / November open at 2736/44. A close above this threshold would be needed suggest a more significant low is in place / mark uptrend resumption towards subsequent resistance objectives at the record high-close (2787) and the 2.618% extension of the 2022 range at 2804- look for a larger reaction there IF reached.
Bottom line: A reversal off technical resistance is now testing initial support hurdles at the August uptrend. Look for a breakout of the November opening-range in the days ahead with the medium-term threat for a larger correction with the broader uptrend. From a trading standpoint, rallies would need to be limited to the monthly open IF price is heading lower on this stretch with a close below 2672 needed to keep the immediate short-bias viable. Look of larger reaction on a stretch towards 2600 IF reached.
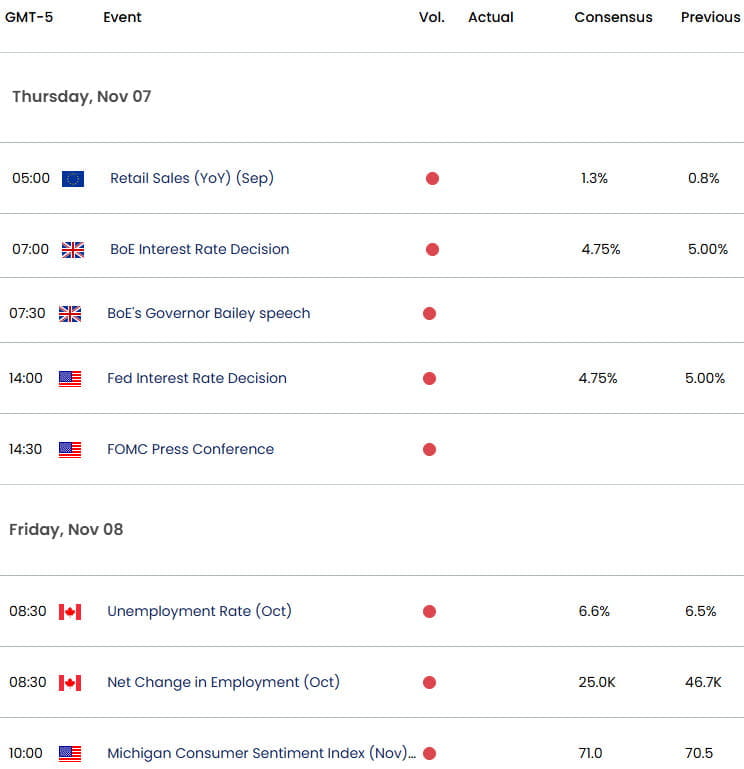
Keep in mind we get the release of the Federal Reserve interest rate decision tomorrow with the central bank widely anticipated to cut another 25 basis points. Stay nimble into the release and watch the weekly close here for guidance. Review my latest Gold Weekly Technical Forecast for a closer look at the longer-term look at the XAU/USD trade levels.
Key Economic Data Releases

Economic Calendar - latest economic developments and upcoming event risk.
Active Short-term Technical Charts
- Swiss Franc Short-term Outlook: USD/CHF Rally Vulnerable into Fed
- Japanese Yen Short-term Outlook: USD/JPY Stalls into US Election, Fed
- British Pound Short-term Outlook: GBP/USD Bears Charge Support
- Euro Short-term Outlook: EUR/USD Rebound Tempts Breakout Ahead of NFP
- US Dollar Short-term Outlook: USD Bulls Relent at Resistance
- Australian Dollar Short-term Outlook: AUD/USD Bears Charge 6600
- Canadian Dollar Short-term Outlook: USD/CAD at Resistance- BoC on Tap
--- Written by Michael Boutros, Sr Technical Strategist with FOREX.com
Follow Michael on X @MBForex


