Gold Talking Points:
- Gold prices have been quiet and range-bound for going on two weeks now.
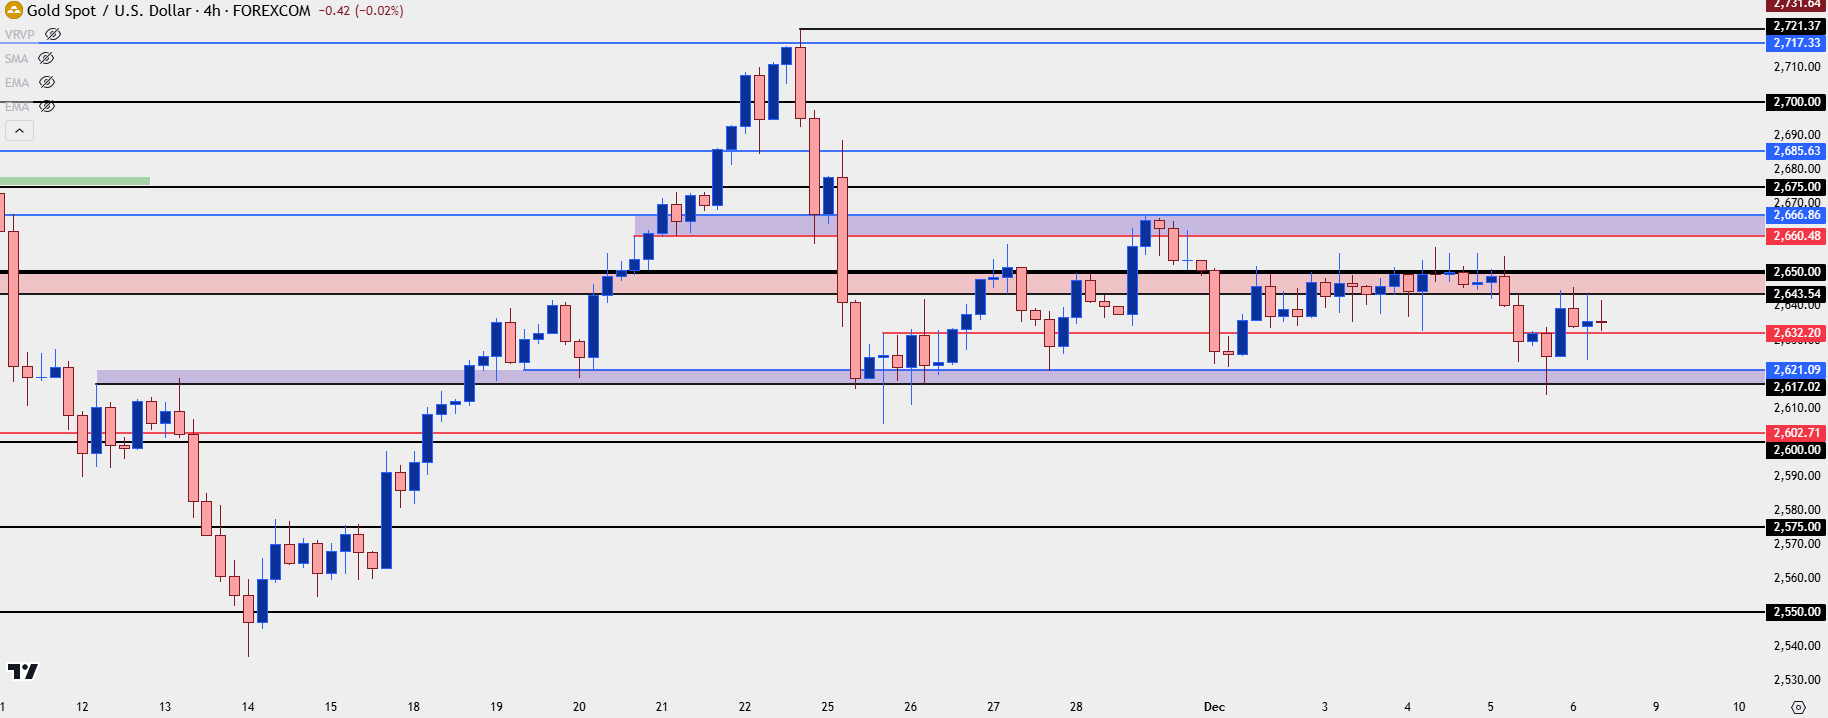
- While volatility has been low, there has been adherence to previously-defined support and resistance. Support at 2617-2621 has held multiple inflections, as has resistance in the 2643-2650 zone.

For gold traders that had gotten accustomed to ripping volatility and strong trends for the past ten months, the past two weeks of range-bound grind likely comes as a change-of-pace. November itself was a change-of-pace, as gold broke a nine-month streak of gains with its first red bar on the monthly chart since January.
Putting that recent volatility into context: The post-election move in gold was aggressively bearish, and that led into a pullback in mid-November as the metal showed its strongest weekly gain in over a year. And then two weeks ago opened with a strong sell-off but the support that came into play from that, at 2617-2621, has remained in-play for the past two weeks with multiple inflections.
Gold Four-Hour Price Chart
 Chart prepared by James Stanley; data derived from Tradingview
Gold Levels
Given the consistency of the range over the past two weeks, it would be difficult to derive any directional biases. But there are still a plethora of levels on either side that remain of interest, and if those come into play, and when, could be telling as to how traders may look to impart strategy on the matter.
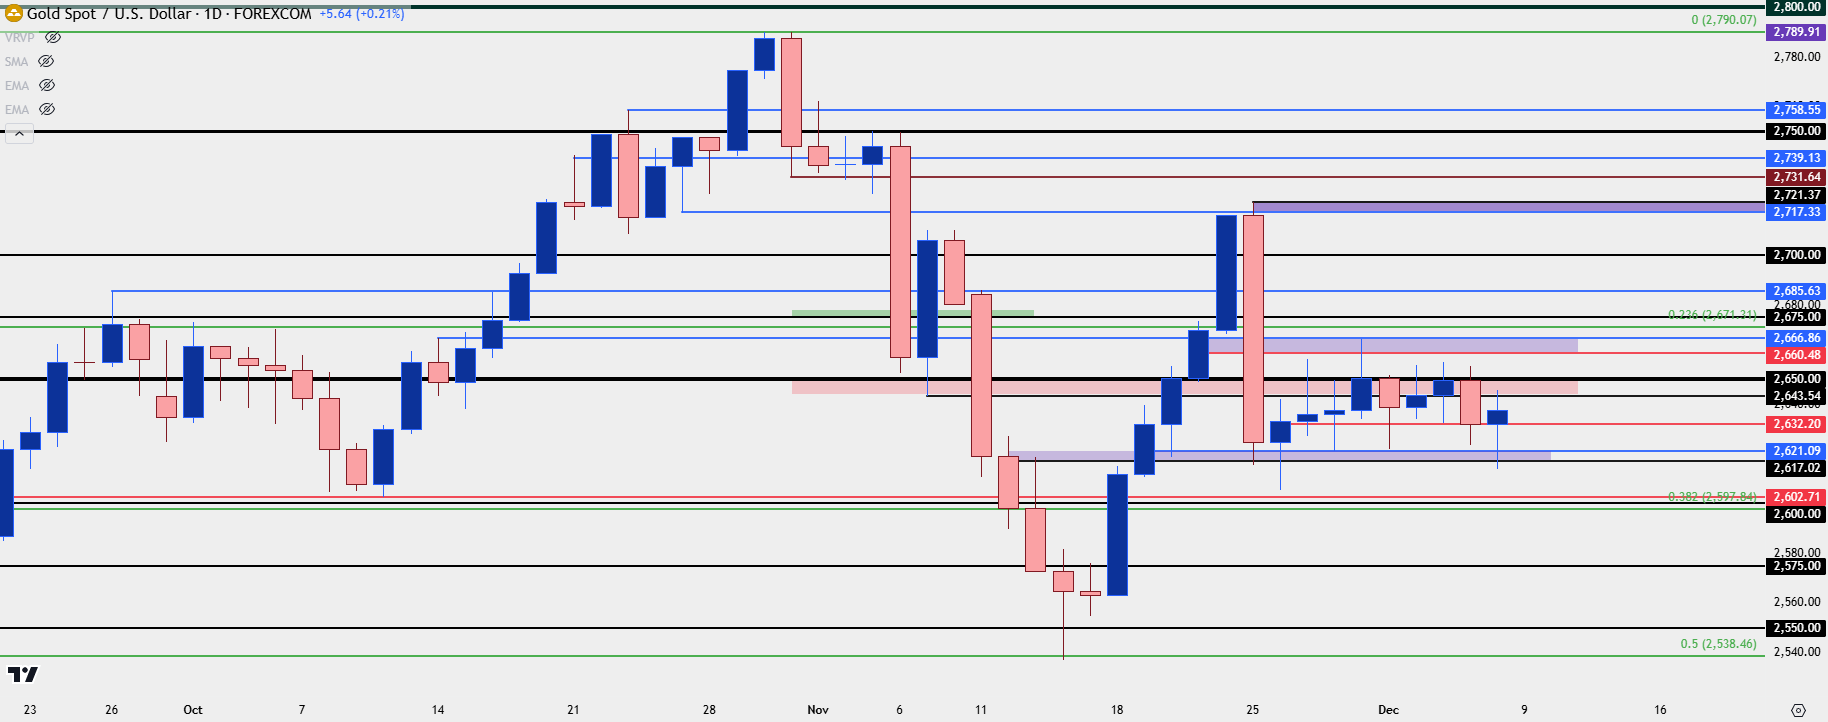
Below the 2617-2621 support zone, the 2600 level is key and the 38.2% retracement of the June-October move plots nearby at 2597. If sellers can breach through that, then the next major area on the chart would be the 50% retracement of that same major move which caught the post-election low at 2538.
Sitting overhead, the 2643-2650 resistance zone has been the most active with multiple tests over the past week, but another zone sits just above that from 2660-2666, and that’s what caught the highs last week. Above that zone, there’s a few different items of note such as a Fibonacci level at 2667, a psychological level at 2675 and then a prior price swing at 2685.
For key resistance, I’m tracking that in a zone that’s $100 above current range support, at 2717-2721. That was the spot that held the highs from the late-November bounce and there’s two prior price swings demarcating each side of that zone. If buyers can push through that, I would consider that a strong exhibit of control and something that could open the door to longer-term bullish continuation scenarios.
Gold Daily Price Chart
 Chart prepared by James Stanley; data derived from Tradingview
--- written by James Stanley, Senior Strategist
Gold Talking Points:
- Gold prices have been quiet and range-bound for going on two weeks now.
- While volatility has been low, there has been adherence to previously-defined support and resistance. Support at 2617-2621 has held multiple inflections, as has resistance in the 2643-2650 zone.
Gold AD
For gold traders that had gotten accustomed to ripping volatility and strong trends for the past ten months, the past two weeks of range-bound grind likely comes as a change-of-pace. November itself was a change-of-pace, as gold broke a nine-month streak of gains with its first red bar on the monthly chart since January.
Putting that recent volatility into context: The post-election move in gold was aggressively bearish, and that led into a pullback in mid-November as the metal showed its strongest weekly gain in over a year. And then two weeks ago opened with a strong sell-off but the support that came into play from that, at 2617-2621, has remained in-play for the past two weeks with multiple inflections.
Gold Four-Hour Price Chart
 Chart prepared by James Stanley; data derived from Tradingview
Gold Levels
Given the consistency of the range over the past two weeks, it would be difficult to derive any directional biases. But there are still a plethora of levels on either side that remain of interest, and if those come into play, and when, could be telling as to how traders may look to impart strategy on the matter.
Below the 2617-2621 support zone, the 2600 level is key and the 38.2% retracement of the June-October move plots nearby at 2597. If sellers can breach through that, then the next major area on the chart would be the 50% retracement of that same major move which caught the post-election low at 2538.
Sitting overhead, the 2643-2650 resistance zone has been the most active with multiple tests over the past week, but another zone sits just above that from 2660-2666, and that’s what caught the highs last week. Above that zone, there’s a few different items of note such as a Fibonacci level at 2667, a psychological level at 2675 and then a prior price swing at 2685.
For key resistance, I’m tracking that in a zone that’s $100 above current range support, at 2717-2721. That was the spot that held the highs from the late-November bounce and there’s two prior price swings demarcating each side of that zone. If buyers can push through that, I would consider that a strong exhibit of control and something that could open the door to longer-term bullish continuation scenarios.
Gold Daily Price Chart
 Chart prepared by James Stanley; data derived from Tradingview
--- written by James Stanley, Senior Strategist

 Chart prepared by James Stanley; data derived from Tradingview
 Chart prepared by James Stanley; data derived from Tradingview


