Key Events
- Markets are bracing for final central bank decisions and insights for 2024 ahead of the holiday season
- UK GDP contracted by -0.1%, raising questions ahead of Thursday’s BOE decision
- FOMC and BOJ meetings next Wednesday and Thursday are expected to heighten market volatility
- Key GBP events to watch: Flash PMI (Monday), employment data (Tuesday), and the BOE decision (Thursday)
US Data
Following the uptick in US CPI and PPI data, and the market’s priced in a Fed rate cut for next week, the US Dollar index stabilized above the 107-mark again. If the 108-resistance zone is breached, currencies may face critical lows, prompting central banks to adopt aggressive measures to stabilize their economies. Banks like the SNB, BOC, and PBOC have already announced drastic actions, with the ECB potentially following suit ahead of risks tied to Trump's policies in 2025.
UK Data
Expectations of a BOE rate hold have been driven by inflationary pressures from the UK’s new labor law. However, the contraction in GDP to -0.1% heightens concerns about economic growth and complicates the BOE’s decision-making process. Increased volatility in the British pound is expected next week, influenced by flash PMI data on Monday and employment figures on Tuesday, which will play a final pivotal role in shaping BOE insights.
Technical Analysis: Quantifying Uncertainties
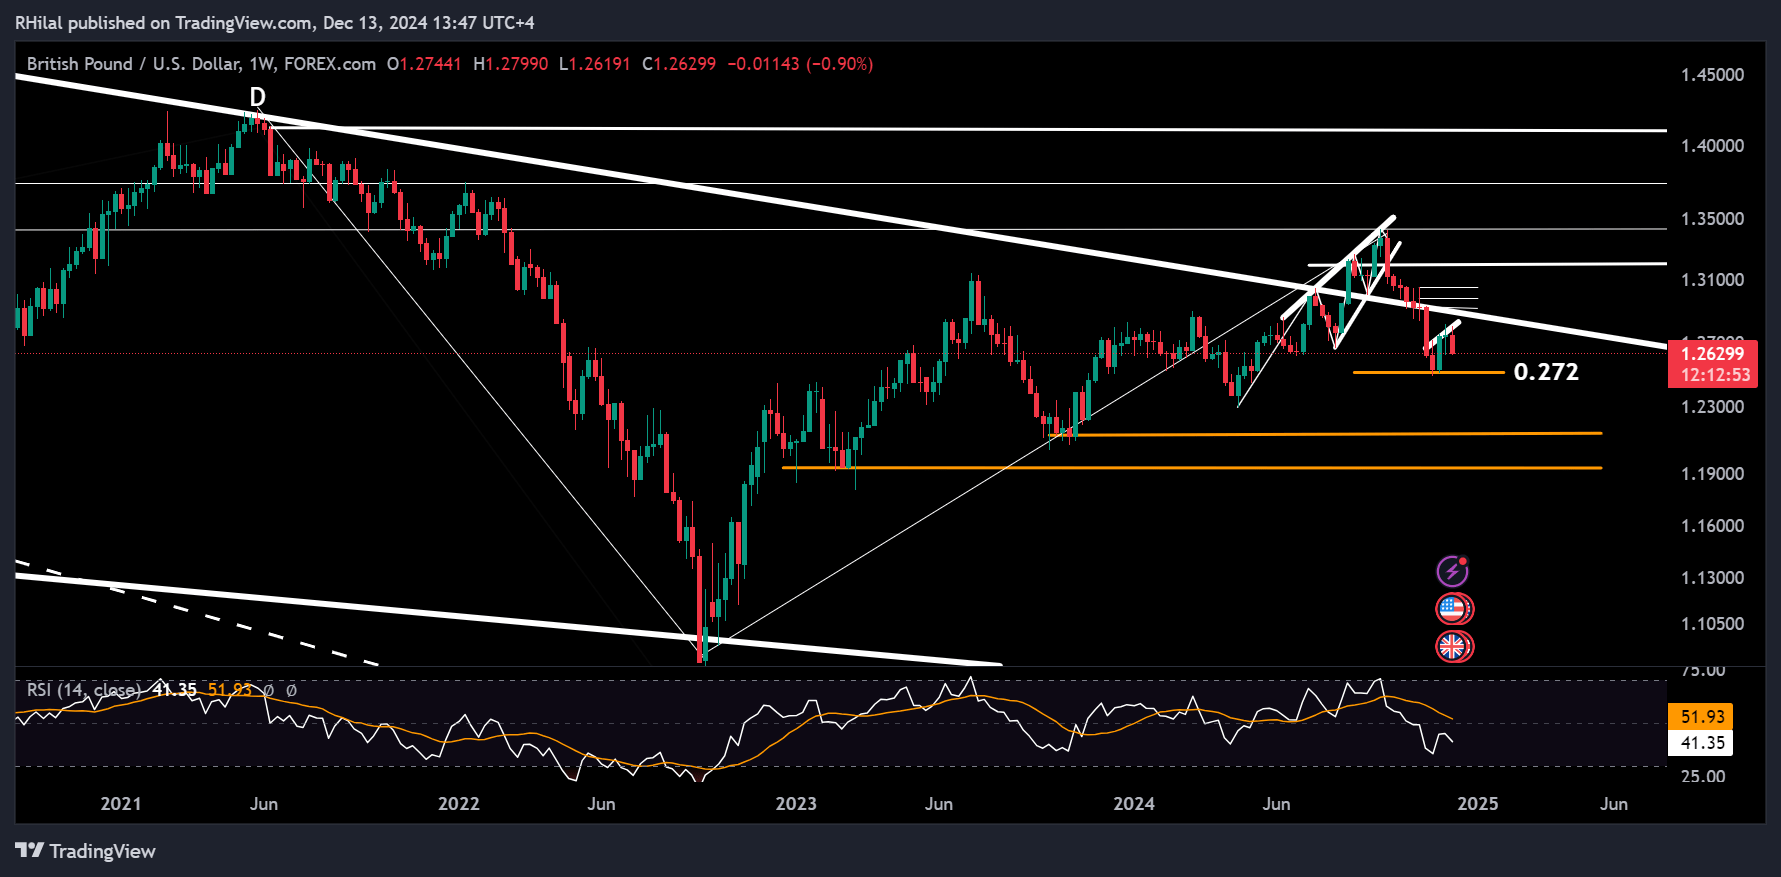
GBPUSD Forecast: Weekly Time Frame – Log Scale

Source: Tradingview
Using the Fibonacci extension tool between the 2021 high, 2022 low, and 2024 high, the recent drop in GBPUSD has found support at the 0.272 extension level. The next significant support level lies at the 0.382 extension. Should GBPUSD fail to sustain its rebound above the critical 1.2480 level, further declines could test support zones between the October 2023 and February 2023 lows, with support zones 1.21 and 1.19.
On the upside, the current candlestick pattern forming above the 1.25 support indicates a weekly bullish engulfing pattern, signaling strong reversal potential. Key resistance levels to watch to resume a bullish scenario include 1.30 and 1.3170.
--- Written by Razan Hilal, CMT on X: @Rh_waves and Forex.com You Tube


