Article Outline
- Key Events: UK Economic Indicators, US CPI, and Fed Rate Expectations
- Technical Analysis: GBPUSD 3 Day Time Frame
- Technical Analysis (TA) Tip: RSI zones and Fibonacci Levels

Source: CME Fed Watch Tool
With inflation concerns rising in 2025, the likelihood of a rate hold or even a rate hike looms large. The final Non-Farm Payroll result of 2024 exceeded expectations with a strong addition of 256,000 jobs, boosting Fed pause expectations to 97% while introducing the possibility of rate hikes in the year ahead.
Concerns over inflation, combined with uncertainty surrounding upcoming Trump policies, have driven the U.S. Dollar Index toward the 110-mark, exerting pressure on global currencies. This has led to cautious monetary stances from central banks and pushed currencies like the euro near parity and the pound toward October 2023 lows, sinking further into its 15-year extended consolidation range.
In addition to the expected volatility from this week’s U.S. CPI report on Wednesday, UK inflation, GDP, and Retail sales data are set to heighten market fluctuations for the pound. UK inflation expectations have stabilized at 8-months of 2.6%, while monthly GDP forecasts range from -0.1% to 0.2%, marking a potential 3-month high.
Pound bulls are closely monitoring these metrics, hoping for improvements to support a potential recovery against the dollar.
Technical Analysis: Quantifying Uncertainties
GBPUSD Forecast: 3-Day Time Frame – Log Scale

Source: Trading view
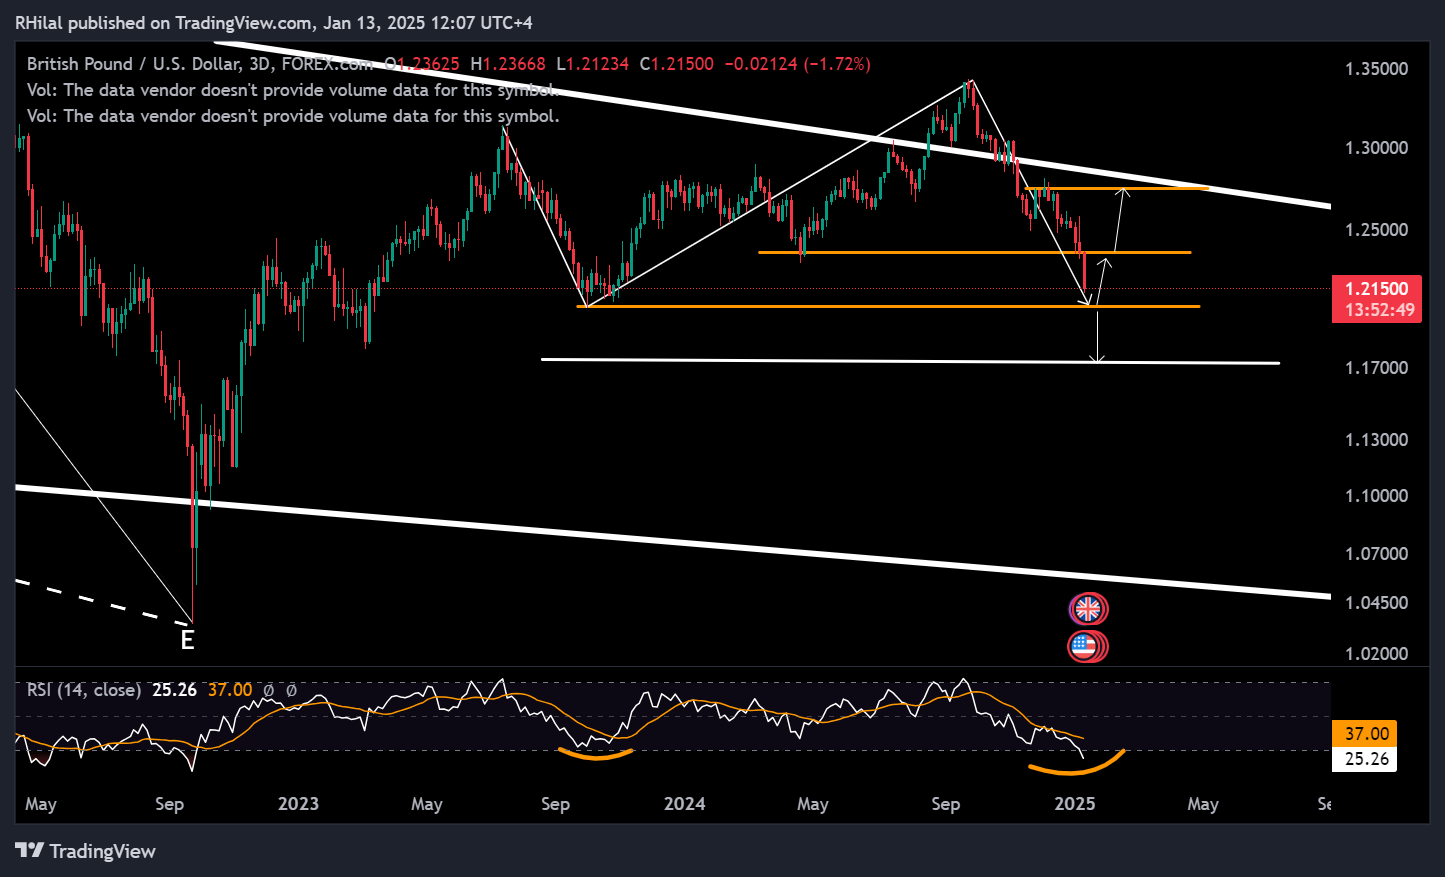
Breaking below the 2024 low at 1.2330, the GBP/USD accelerated its decline toward the October 2023 low at 1.2030. Extreme conditions on the chart highlight the significance of the next support levels, particularly the 1.272 Fibonacci extension, drawn from the July 2023 high (1.3125), October 2023 low (1.2030), and September 2024 high (1.3434).
These levels align with previously observed oversold conditions on the Relative Strength Index (RSI) in October 2023 and September 2022. If the current support holds, a potential reversal could push the pair back toward the resistance at 1.2770, coinciding with the upper border of the 15-year consolidation range.
However, this would require a decisive close above the 2024 lows at 1.2330. Should bearish pressures continue below the critical 1.20 level, further declines could target the 1.5 and 1.618 Fibonacci extension levels, which align with the 1.18 and 1.1670 zones, respectively.
Written by Razan Hilal, CMT
Follow on X: @RH_waves
You Tube: Forex.com


