It’s been an interesting week for central bank watchers, as Canada and UK’s inflation figures could sway bets over a potential June cut from the BOC or BOE. On Tuesday we saw the last of the three BOC’s preferred CPI measures fall within their 1-3% target band. But what excited traders about a potential June cut was core CPI y/y slowing to 1.6% (below the 20% midpoint) and down to 0.2% m/m (0.6% previously). And that has generated some excitement that UK inflation data could follow suit. However, I remain apprehensive that it will soften fast enough (or at al) to give traders the confirmation of BOE they so desperately want.
Key data points head of the next BOE meeting:
- CPI, PPI – May 22nd
- Retail sales - May 24th
- Employment, earnings – June 11th
- BOE meeting – June 20th

Yes, UK inflation is slowing. Yet it remains elevated relative to the BOE’s % target and to the figures seen from Canada. CPI was still 1.2 percentage points above the BOE’s 2% target at 3.2% in the prior report, and core CPI more than twice the target at 4.2% y/y. Average earnings less bonus are still at 6% and above the BOE’s cash rate of 5.25%. Furthermore, the Citi Inflation Surprise Index (CISI) is higher for the first month in eight heading into today’s inflation report, which suggests inflation may even heat up – if not remain flat at elevated levels.
The consensus estimates CPI to slow to 2.1% from 3.2%. And that is quite a drop, which risks disappointment. And a core CPI estimate of 3.6% y/y still may not tempt the BOE to signal a cut, especially with it expected to rise 0.7% m/m from 0.6% previously, with some measures of producer prices expected to also heat up.
On balance I suspect odds favour softer inflation overall, but not at a rate that could justify the BOE signalling a rate cut in June. And that leaves the potential for GBP to strengthen.
GBP/USD market positioning from the COT report:
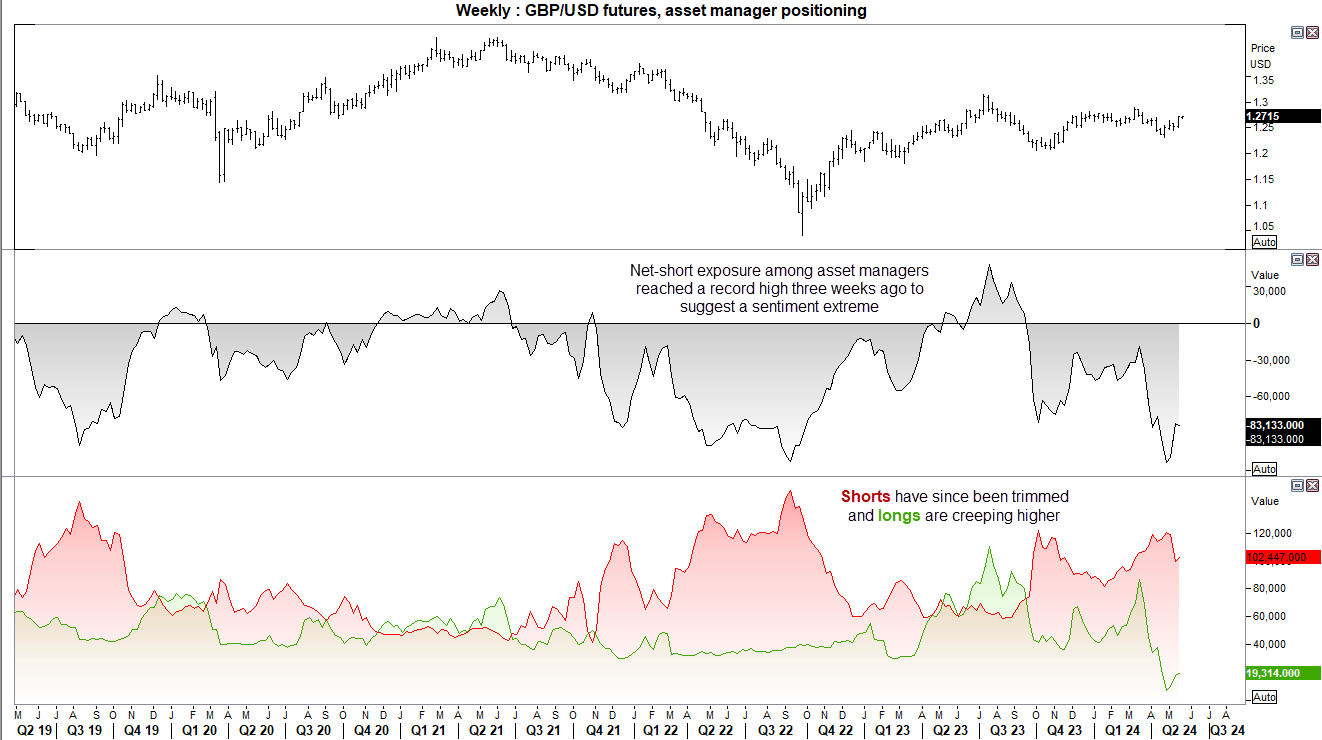
Asset managers’ net-short exposure to GBP/USD futures reached a record high three weeks ago. Since then we have seen a reduction of short exposure and increase in longs, which suggests real money account may have marked a sentiment extreme. If US data continues to soften to maintain the case of Fed cuts, it likely overshadows the potential for BOE cuts. Besides, we’re not even sure if the BOE will cut as soon as June, so we may find that a weaker US dollar continues to support a higher GBP/USD in the months ahead.

GBP/USD diverges from yield differentials
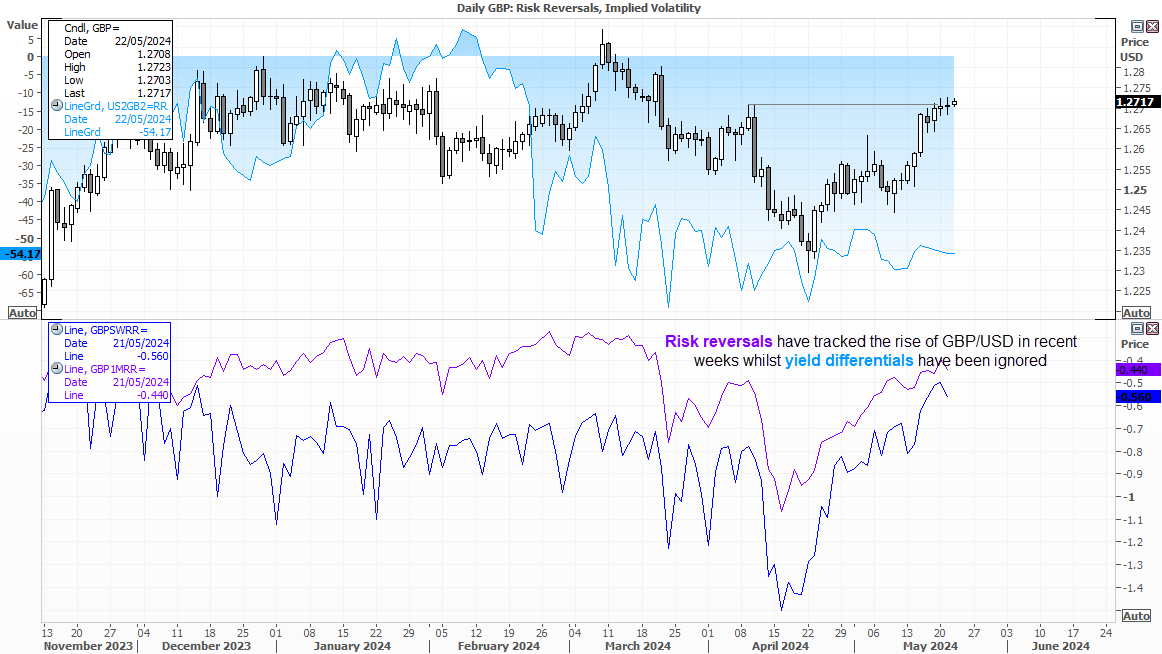
Cable has risen 3.5% since the April low, yet its rally has not been backed up by the 2-year yield differential between the UK and US. And that is because the US dollar has weakened on expectations of Fed cuts, although that is yet to be reflected by the bond market by lower US yields. If the bond market has is right, GBP/USD could be overvalued.
However, the 1-week and 1-month risk reversals for GBP/USD has been rising in tandem with GBP/USD which shows less put demand for the British pound in relation to the US (less downside perceived risk). It has edged lower this week in preparation for today’s inflation print, presumably as downside protection in case inflation comes in softer than expected.
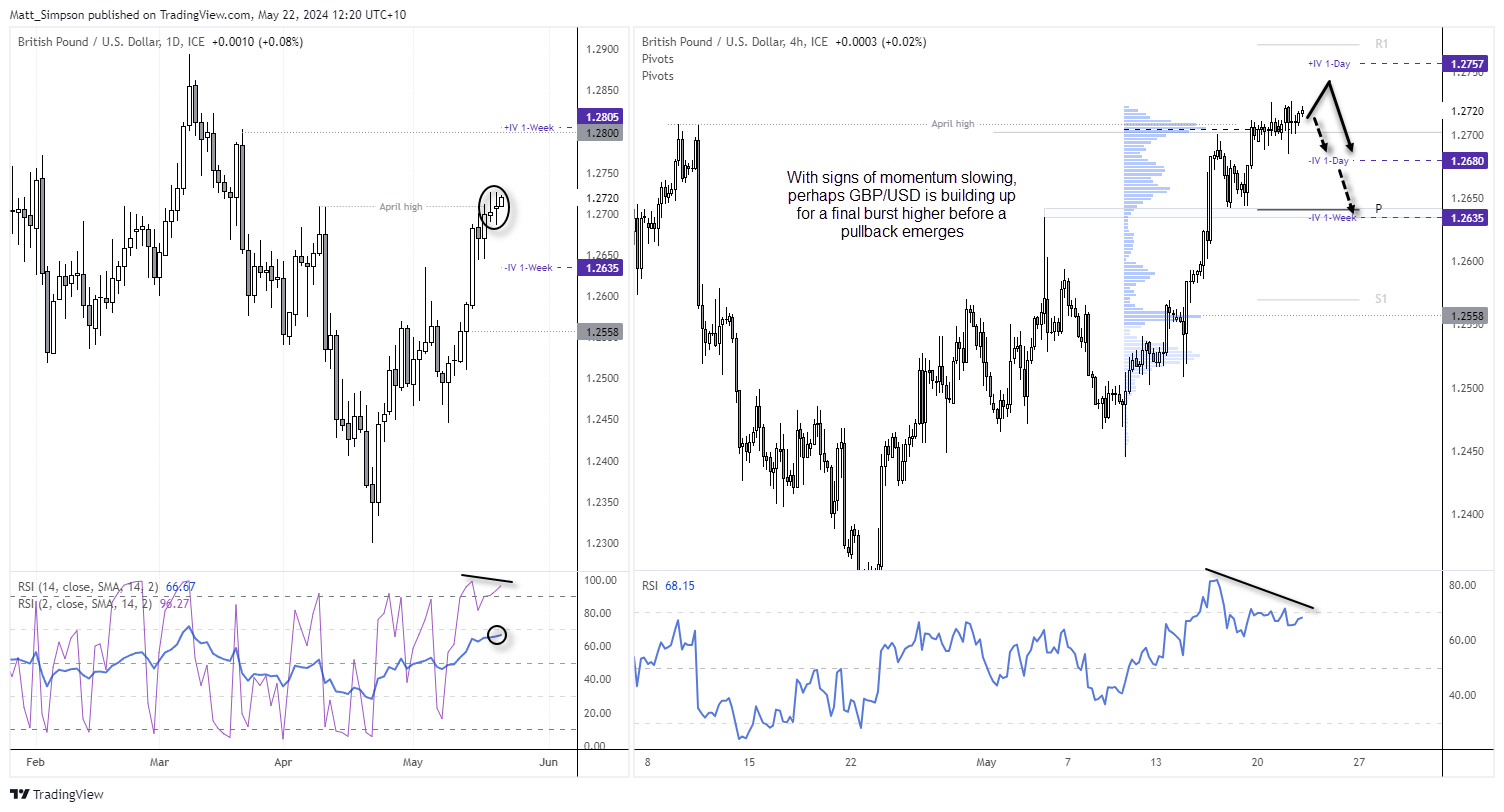
The daily chart of GBP/USD shows the bullish momentum is waning around the April high and two doji’s have formed to show indecision. As GBP/USD is ignoring yields, GBP/USD appears poised to continue higher unless CPI data satisfies doves enough to bet on a June rate cut.

GBP/USD technical analysis:
Prices are holding above the 1.27 handle and April high at the time of writing, and the daily chart shows the strength of the trend. However, the two doji’s at the highs show a loss of momentum whilst the RSI (2) is forming a small bearish divergence within the overbought zone. RSI (14) is also approaching oversold, but not quite there yet. The 1-week implied volatility band implies a 68% chance GBP/USD will close between 1.2635 – 1.285 over the next week.

The 4-hour chart shows that prices are effectively hugging the monthly R1 pivot despite intra-bar breaks beneath it. Yet price action is also choppy to show all may not be well at these highs for bulls. A bearish divergence is also forming on this timeframe.
I cannot help but wonder if a hotter-than-lived CPI print could mark a final burst higher for GB/USD before a retracement below 1.27 occurs and prices head for the support zone between 1.2635/45, which includes the weekly pivot point, 1-week IV band and prior swing high and low.
-- Written by Matt Simpson
Follow Matt on Twitter @cLeverEdge


