EUR/USD, US Dollar Talking Points:
- The biggest data item of the week is unveiled tomorrow morning with the release of Core PCE, often considered to be the Fed’s ‘preferred inflation gauge.’
- EUR/USD put in a sizable resistance reaction yesterday after testing a long-term Fibonacci level, and that helped the USD to bounce after setting a higher-low on Tuesday evening. The big question now is whether those swings can continue, and tomorrow’s print will likely have sway on the matter.
The US Dollar was not looking very attractive when I had looked at it in the webinar on Tuesday. But, as I shared then, there were a couple of deductive items that could be of interest for those looking at swings. RSI went oversold on the weekly chart in August and that’s an infrequent type of thing. Since then, sellers have continued to stall at tests of lows, including at the FOMC’s rate cut announcement last week, and that’s helped RSI to show divergence on the daily chart. And then on Tuesday evening, a few hours after that webinar, USD bears once again had an open door to run with a trend as price pushed closer and closer to last week’s swing low. But – they failed to do so; the low held one pip above the FOMC swing low and price slowly started to build higher-lows.
Yesterday morning showed a more spirited movement but there was some help from counter-parts, as I had shared in the article. EUR/USD had pushed up for a test of a long-term Fibonacci level and that’s around the time prices began to reverse in the pair, helping to buoy the US Dollar in what ended up being its strongest one-day rally since June.
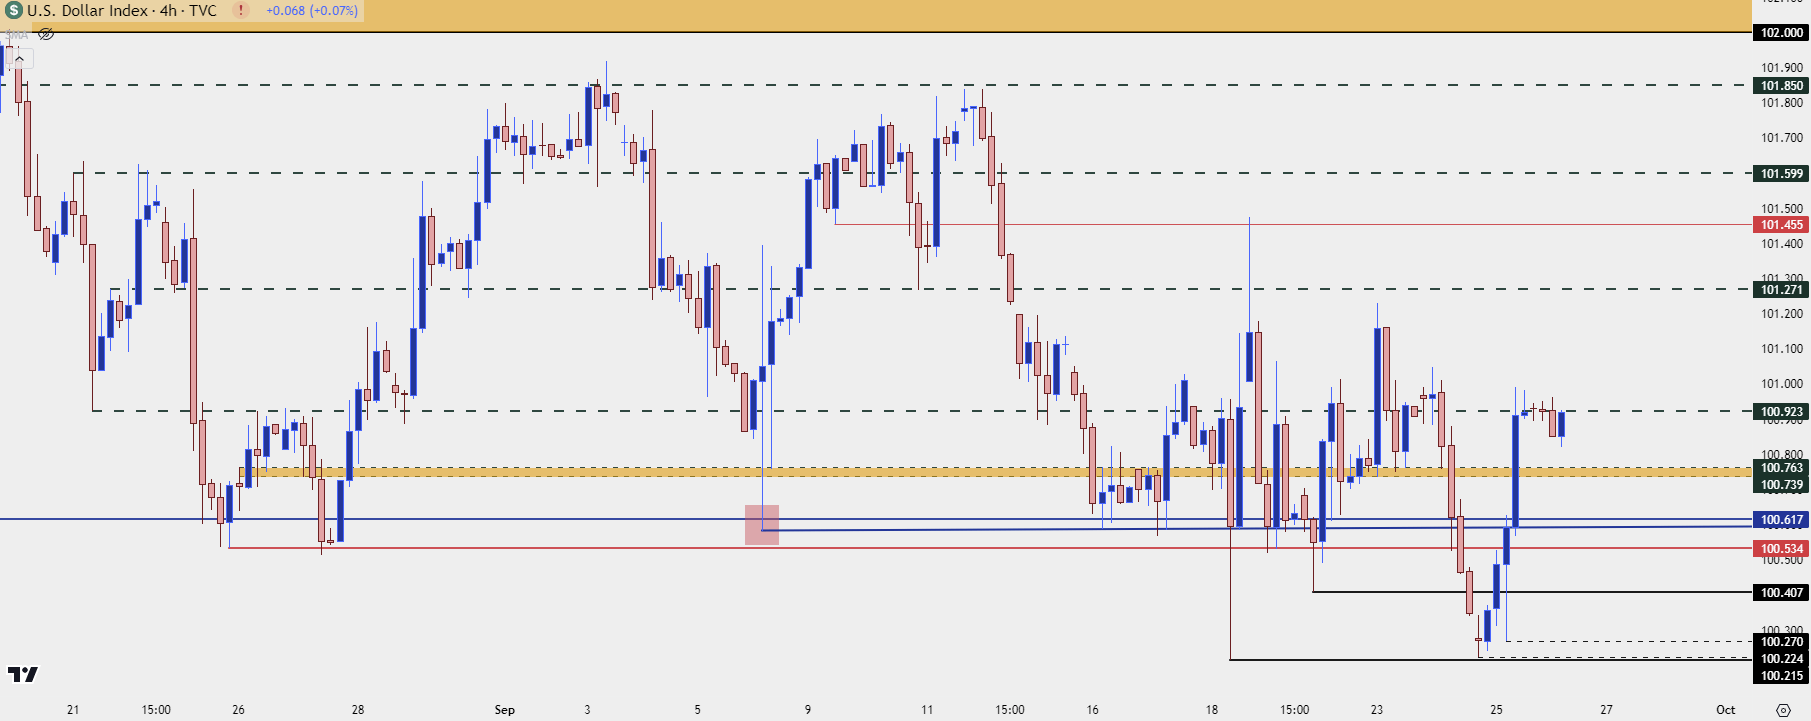
It’s still early-stage, however, and if the bounce is to continue, we’re likely going to need some continued help from EUR/USD bears. In the DXY, price has so far held resistance at the 100.92 level. There’s higher-low support potential above 100.27 which was yesterday morning’s swing-low. Of specific interest, I’m tracking zones at 100.74-100.76, then at 100.62 and 100.52, all levels that have had some sway over the past month. The argument for higher-low support can be substantiated as long as buyers show up ahead of a re-test of the 100.27 level, so this also keeps open the possibility of 100.41.
US Dollar Four-Hour Price Chart
 Chart prepared by James Stanley; data derived from Tradingview
EUR/USD
I wanted to center this article around EUR/USD but to do so I first needed to explain context in USD. The reason being, the rally that’s shown in the major pair seems difficult to justify given the fundamental outlay.
Europe isn’t exactly in a much healthier spot than the US and the European Central Bank is also in a rate cutting cycle. Perhaps the one advantage that the ECB has is that they had the foresight to suspend forward guidance well-ahead of their cutting campaign, giving markets less data to lean on for future expectations.
But if we look at EUR/USD in Q3 it would be difficult to muster anything other than a bullish outlook. Buyers have simply continued to drive-higher throughout the quarter with continued highs and lows.
By comparison, however, there’s more to be desired. GBP/USD, for instance, has ripped up to fresh two-year-highs and AUD/USD has put in large bullish extension moves. Even USD/JPY, where the fundamental backdrop is worsening as rate divergence tightens the rate divergence between those two economies, the pair has put in a pretty bullish backdrop since last week’s open.
In EUR/USD, however, the argument can be made that the pair remains within the same range that’s held for the past 21 months. August produced a lower-high at 1.1200, inside of the 1.1275 from last year; and I talked about the ‘capitulation scenario’ in the Tuesday webinar, highlighting the fact that failure from bulls to drive on tests of fresh highs could start to open the door for reversals.
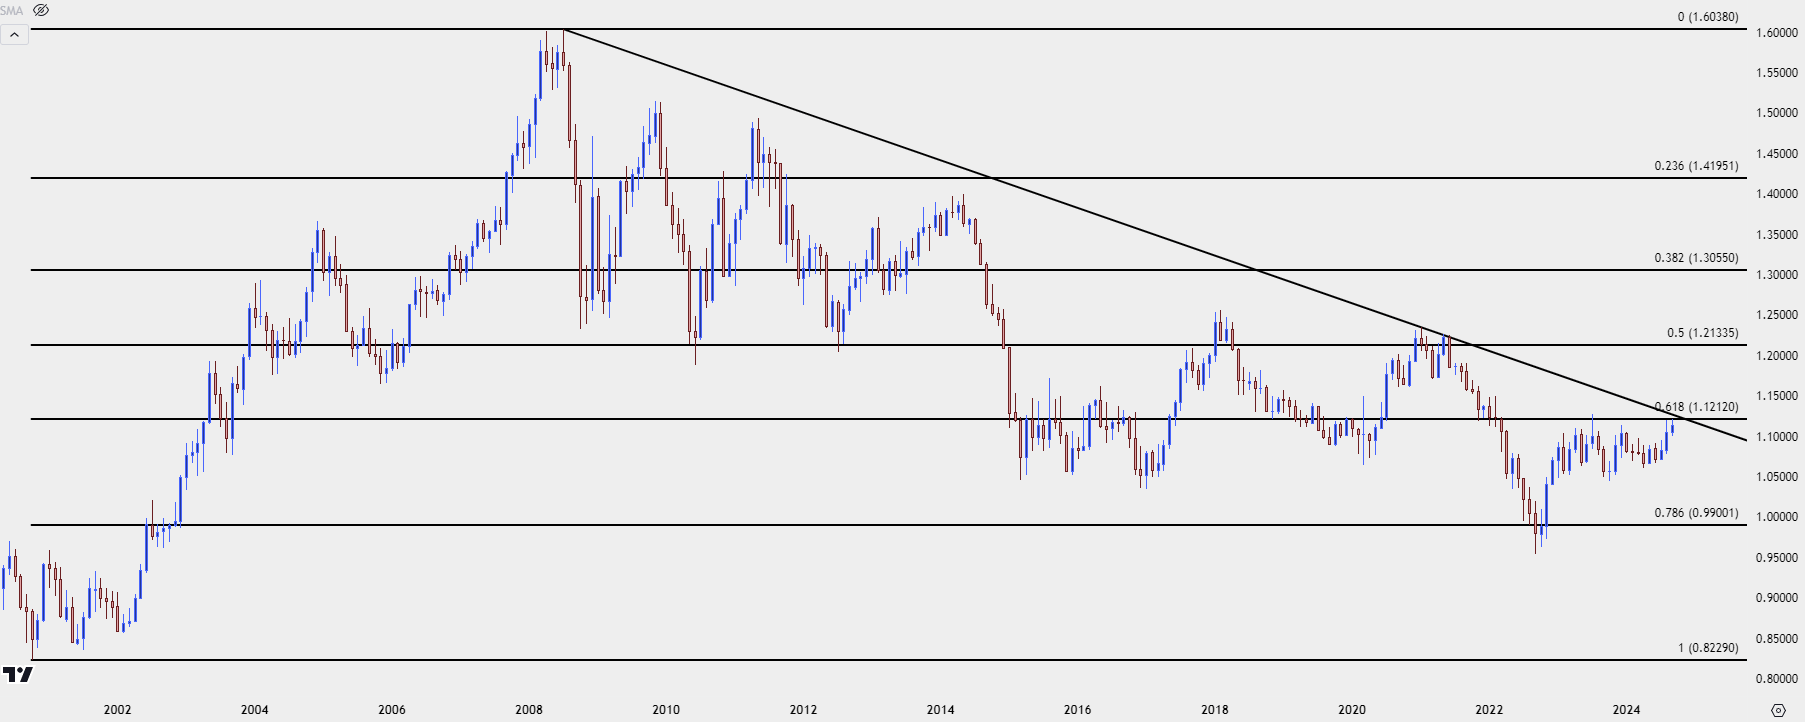
So far that’s what we’ve seen as yesterday’s fresh yearly high has been a lead-in for sellers to take a swing. That high arrived at a key spot of 1.1212, which is the 61.8% Fibonacci retracement of the ‘lifetime move’ in EUR/USD.
EUR/USD Monthly Chart
 Chart prepared by James Stanley, EUR/USD on Tradingview
EUR/USD: Tracking a Possible Turn
So far, bulls have failed at resistance but this is still early-stage, especially considering the beating that the US Dollar has taken in Q3. The big question now is whether sellers continue to push-in to the market, defending that swing-high from yesterday while showing anticipation of a possible turn.
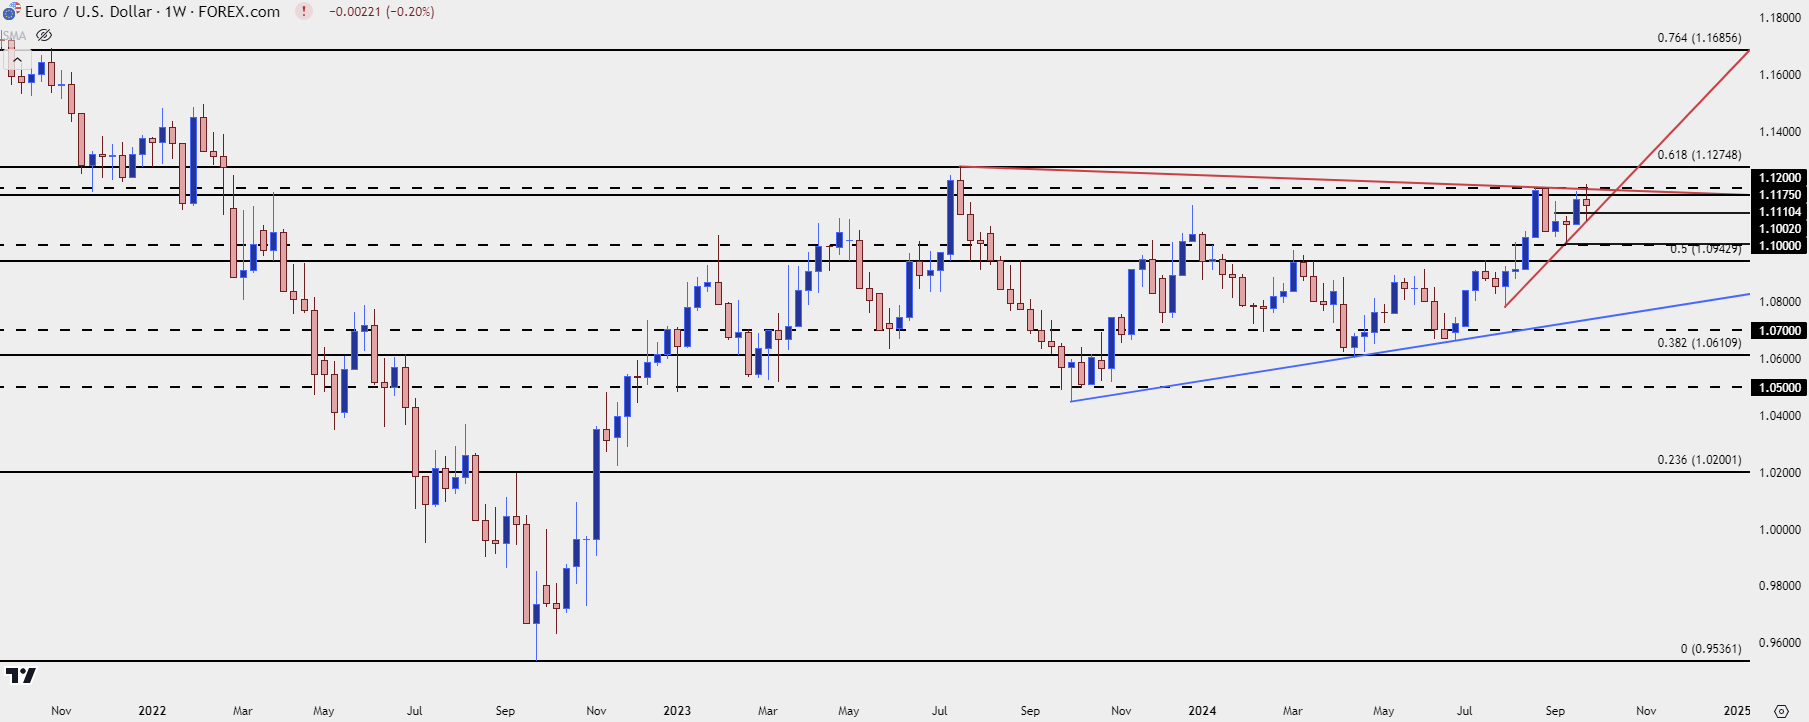
From the weekly chart below, we can see that we’re in a highly-contested area around that 1.1200 handle. And this puts focus on tomorrow’s Core PCE report as giving EUR/USD bears, and USD bulls a bit of motivation will show just how ready they are to push prices back into the prior range.
EUR/USD Weekly Price Chart
 Chart prepared by James Stanley, EUR/USD on Tradingview
EUR/USD Shorter-Term
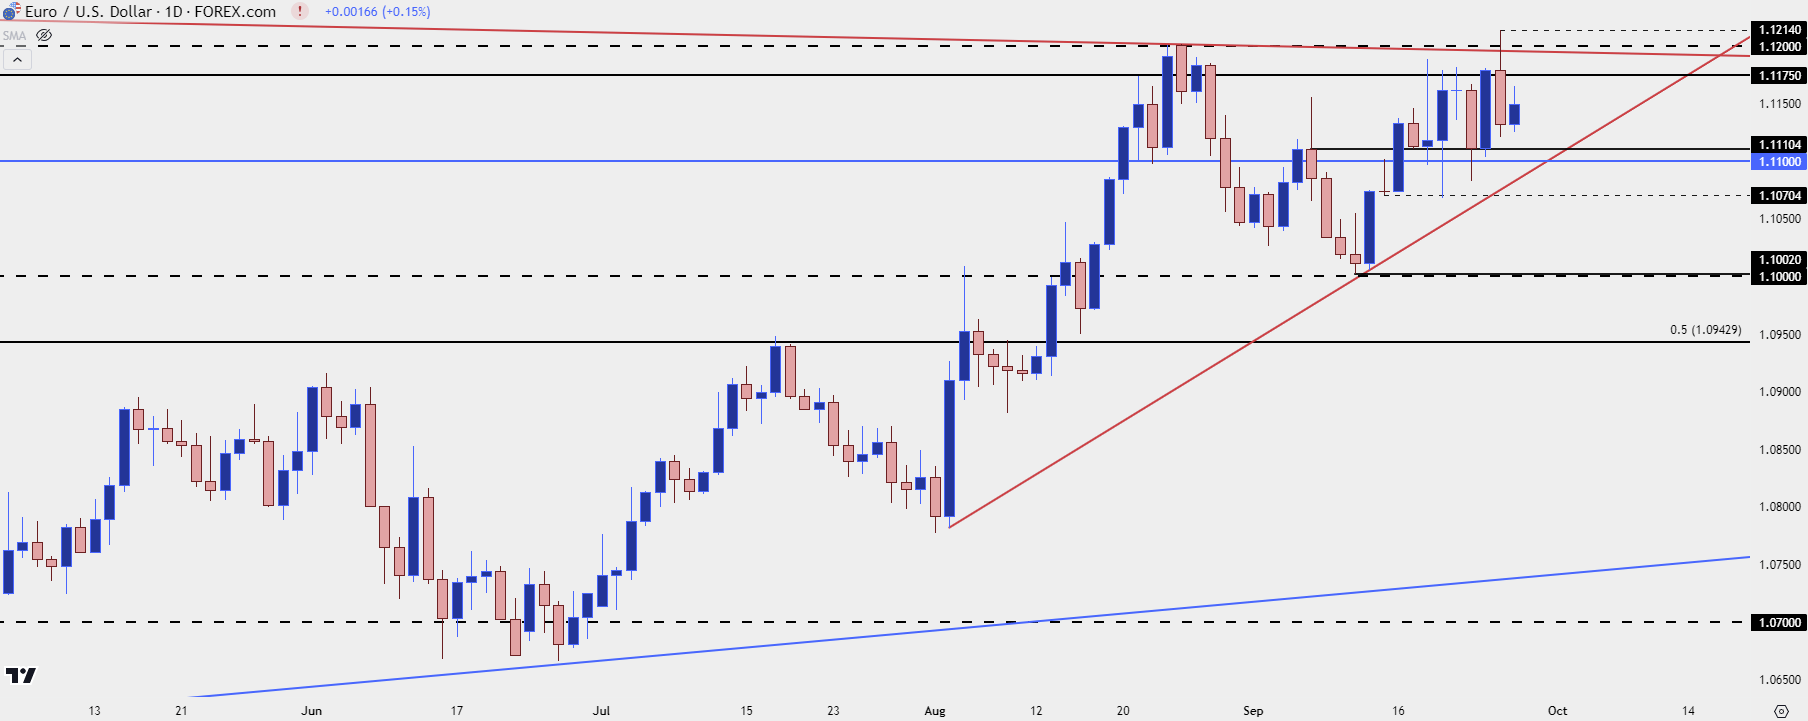
From the daily we can get a bit of additional context: It was the 1.1175 level that held the highs last week even when bulls had an open door to re-test 1.1200 and above that, of course, the 1.1200 level looms large as this held the highs back in August. So long as price holds a lower-high inside of yesterday’s high of 1.1214, the door is open for swing scenarios.
On the support side of the coin, the 1.1110 level has had some impact, albeit in a messy manner, but below that we have the bullish trendline which currently projects to right around the 1.1100 handle for tomorrow. Below that, there’s a prior price swing at 1.1070 and then the 1.1000 psychological level is a big spot, as this was defended two weeks ago, leading into the ‘rate cut rally’ after the ECB meeting.
EUR/USD Daily Price Chart
 Chart prepared by James Stanley, EUR/USD on Tradingview
--- written by James Stanley, Senior Strategist
EUR/USD, US Dollar Talking Points:
- The biggest data item of the week is unveiled tomorrow morning with the release of Core PCE, often considered to be the Fed’s ‘preferred inflation gauge.’
- EUR/USD put in a sizable resistance reaction yesterday after testing a long-term Fibonacci level, and that helped the USD to bounce after setting a higher-low on Tuesday evening. The big question now is whether those swings can continue, and tomorrow’s print will likely have sway on the matter.
The US Dollar was not looking very attractive when I had looked at it in the webinar on Tuesday. But, as I shared then, there were a couple of deductive items that could be of interest for those looking at swings. RSI went oversold on the weekly chart in August and that’s an infrequent type of thing. Since then, sellers have continued to stall at tests of lows, including at the FOMC’s rate cut announcement last week, and that’s helped RSI to show divergence on the daily chart. And then on Tuesday evening, a few hours after that webinar, USD bears once again had an open door to run with a trend as price pushed closer and closer to last week’s swing low. But – they failed to do so; the low held one pip above the FOMC swing low and price slowly started to build higher-lows.
Yesterday morning showed a more spirited movement but there was some help from counter-parts, as I had shared in the article. EUR/USD had pushed up for a test of a long-term Fibonacci level and that’s around the time prices began to reverse in the pair, helping to buoy the US Dollar in what ended up being its strongest one-day rally since June.
It’s still early-stage, however, and if the bounce is to continue, we’re likely going to need some continued help from EUR/USD bears. In the DXY, price has so far held resistance at the 100.92 level. There’s higher-low support potential above 100.27 which was yesterday morning’s swing-low. Of specific interest, I’m tracking zones at 100.74-100.76, then at 100.62 and 100.52, all levels that have had some sway over the past month. The argument for higher-low support can be substantiated as long as buyers show up ahead of a re-test of the 100.27 level, so this also keeps open the possibility of 100.41.
US Dollar Four-Hour Price Chart
 Chart prepared by James Stanley; data derived from Tradingview
EUR/USD
I wanted to center this article around EUR/USD but to do so I first needed to explain context in USD. The reason being, the rally that’s shown in the major pair seems difficult to justify given the fundamental outlay.
Europe isn’t exactly in a much healthier spot than the US and the European Central Bank is also in a rate cutting cycle. Perhaps the one advantage that the ECB has is that they had the foresight to suspend forward guidance well-ahead of their cutting campaign, giving markets less data to lean on for future expectations.
But if we look at EUR/USD in Q3 it would be difficult to muster anything other than a bullish outlook. Buyers have simply continued to drive-higher throughout the quarter with continued highs and lows.
By comparison, however, there’s more to be desired. GBP/USD, for instance, has ripped up to fresh two-year-highs and AUD/USD has put in large bullish extension moves. Even USD/JPY, where the fundamental backdrop is worsening as rate divergence tightens the rate divergence between those two economies, the pair has put in a pretty bullish backdrop since last week’s open.
In EUR/USD, however, the argument can be made that the pair remains within the same range that’s held for the past 21 months. August produced a lower-high at 1.1200, inside of the 1.1275 from last year; and I talked about the ‘capitulation scenario’ in the Tuesday webinar, highlighting the fact that failure from bulls to drive on tests of fresh highs could start to open the door for reversals.
So far that’s what we’ve seen as yesterday’s fresh yearly high has been a lead-in for sellers to take a swing. That high arrived at a key spot of 1.1212, which is the 61.8% Fibonacci retracement of the ‘lifetime move’ in EUR/USD.
EUR/USD Monthly Chart
 Chart prepared by James Stanley, EUR/USD on Tradingview
EUR/USD: Tracking a Possible Turn
So far, bulls have failed at resistance but this is still early-stage, especially considering the beating that the US Dollar has taken in Q3. The big question now is whether sellers continue to push-in to the market, defending that swing-high from yesterday while showing anticipation of a possible turn.
From the weekly chart below, we can see that we’re in a highly-contested area around that 1.1200 handle. And this puts focus on tomorrow’s Core PCE report as giving EUR/USD bears, and USD bulls a bit of motivation will show just how ready they are to push prices back into the prior range.
EUR/USD Weekly Price Chart
 Chart prepared by James Stanley, EUR/USD on Tradingview
EUR/USD Shorter-Term
From the daily we can get a bit of additional context: It was the 1.1175 level that held the highs last week even when bulls had an open door to re-test 1.1200 and above that, of course, the 1.1200 level looms large as this held the highs back in August. So long as price holds a lower-high inside of yesterday’s high of 1.1214, the door is open for swing scenarios.
On the support side of the coin, the 1.1110 level has had some impact, albeit in a messy manner, but below that we have the bullish trendline which currently projects to right around the 1.1100 handle for tomorrow. Below that, there’s a prior price swing at 1.1070 and then the 1.1000 psychological level is a big spot, as this was defended two weeks ago, leading into the ‘rate cut rally’ after the ECB meeting.
EUR/USD Daily Price Chart
 Chart prepared by James Stanley, EUR/USD on Tradingview
--- written by James Stanley, Senior Strategist


