EUR/USD: Economic Calendar for August 14th, 2024: Key Events and Potential Market Impact
On August 14th, 2024, numerous economic events in both the European Union (EU) and the United States (US)
These events might bring considerable volatility to the EUR/USD currency pair, a crucial indicator for forex traders and economists alike. At this time even insignificant data releases have moved further into the limelight as market conditions differ from only a few weeks earlier, and other factors are to be considered to gain insight on how other release might play out.
Critical data releases on the agenda for Wednesday the 14th August including the UK Consumer Price Index (CPI) for July, the Eurozone Gross Domestic Product (GDP) figures for the second quarter, and various US inflation indicators.
UK Consumer Price Index (CPI) (MoM) and (YoY) (July)
The UK's CPI data, scheduled for release on August 14th, is a vital indicator of inflation and overall economic health.
In July, analysts expect a slight increase in both MoM and YoY CPI figures. If the actual data exceeds expectations, it could signal rising inflationary pressures in the UK, potentially prompting the Bank of England to consider tightening monetary policy. Higher-than-expected inflation could lead to a stronger British pound (GBP).
Markets to watch: EUR/GBP and EUR/USD pairs.
Eurozone Gross Domestic Product (GDP) (QoQ) and (YoY) (Q2)
The Eurozone GDP data for the second quarter of 2024 is another critical release.
Analysts are closely watching this release as the QoQ expectations lie at 0.3%, the same as the last release. With European earnings mainly lying above expectations, the chances are there to have a higher than expected GDP release and would suggest a resilient economy, likely boosting investor confidence in the euro (EUR).
Markets to watch: EUR/USD
Eurozone Industrial Production (MoM) (June)
The industrial production data for the Eurozone, scheduled for release on August 14th, is a key indicator of the manufacturing sector's health.
Industrial production is closely linked to overall economic growth and with increasing orders especially in the German manufacturing sector, this number could see a boost for this release.
With last release having printed a 0.7% increase opposed to -0.6%, this might be the start of renewed stabilisation.
Markets to watch: EUR/USD
US Core Consumer Price Index (CPI) (MoM) and (YoY) (July)
This is a tough one. Initial Jobless claims were less than anticipated, potentially giving slight relief from the by far under expectations of the Nonfarm Payrolls for July, printed last week on Friday, showing a huge drop in Nonfarm payrolls. Even the once less significant Initial Jobless claims release still created a bullish momentum for markets in the US and EU.
Last Monthly release was 0.1% while forecast was 0.2% and the previous also coming in at 0.2%.
Last YoY release came in slightly below the forecast of 3.4% at 3.3%. Showing slight relief from rising prices.
Should the numbers of the Core CPI figures come in hotter than expected, it could signal renewed increasing inflationary pressures in the US, potentially prompting the Federal Reserve to prolong the current interest rate cycle at these levels to try push inflation back down, which would in turn decreasing the chances of a rate cut at the next meeting.
Markets to watch: EUR/USD, DXY
US Consumer Price Index (CPI) (MoM) and (YoY) (July)
In addition to the Core CPI, the broader US CPI data for July will also be released. This includes all items and provides a comprehensive view of inflation. The MoM and YoY figures will be critical in assessing the inflation trajectory in the US.
MoM for last month came in at -0.1% as opposed to the forecast of 0.1%.
YoY numbers came in at 3.0% with forecasts at 3.1%.
Last release numbers would indicate a cooling off of the numbers, which wold signify a cooling down and increasing chances of an upcoming rate cut. However should the numbers come in higher-than-expected, this could reinforce expectations of tighter for longer monetary policy from the Federal Reserve. Conversely, lower-than-expected figures might alleviate inflation concerns, potentially weakening the USD.
Markets to watch: EUR/USD, DXY, GOLD
US Crude Oil Inventories
The weekly US Crude Oil Inventories report, also scheduled for August 14th, provides insights into supply and demand dynamics in the oil market.
A larger-than-expected drawdown in inventories typically signals strong demand or reduced supply, leading to higher oil prices. This can contribute to inflationary pressures, influencing the CPI data. At last week’s meeting the Actual numbers far overshot the forecast of -1.6000M and came in at an actual reading of -3.728M. If this trend continues, it could signify increased demand. As we currently are in the summer months which is peak driving season in the US, an increased consumption is likely and a higher deficit as forecast is possible, potentially pushing up the price if this is the case.
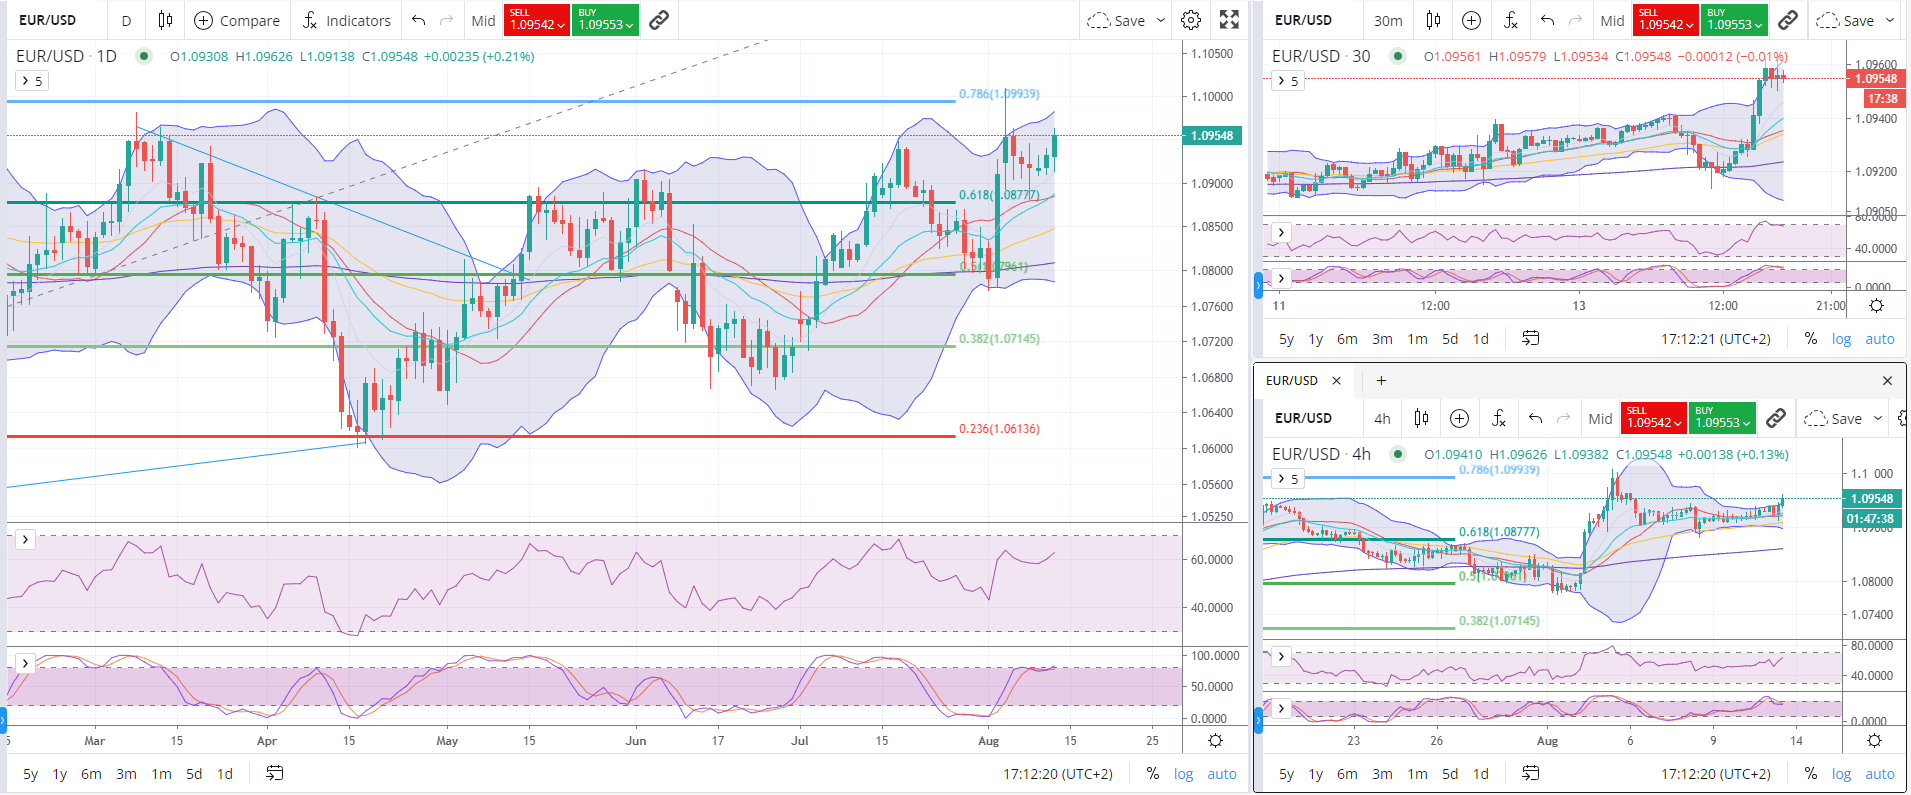
EUR/USD Technical Analysis

The provided chart shows the EUR/USD trading pair with multiple timeframes. The key elements include Bollinger Bands, Fibonacci retracement levels, and Relative Strength Index (RSI) indicators.
Identified Key Levels
Fibonacci Retracement Levels:
0.786: 1.09939
0.618: 1.08777
0.382: 1.07145
0.236: 1.06136
Bollinger Bands: Squeezes and expansions indicate volatility changes. Currently, prices are testing the upper band.
RSI Indicators: Generally hovering near the overbought zone across timeframes, suggesting a potential pullback.
Market Sentiment
Bullish Bias: The EUR/USD is trading near the upper Bollinger Band, above the 0.618 Fibonacci level of 1.08777, indicating upward momentum.


