Key Events for this Week
- A new political atmosphere hits the markets with Biden dropping out
- Flash Manufacturing and Services PMI’s (Wednesday)
- Core PCE (Friday)
New Political Atmosphere
Recent polls indicate a slight edge for Kamala Harris over Biden against former President Donald Trump.

The evolving political landscape, with nearly four months until the election, could impact markets in various ways given the notable differences in the agendas of Harris and Trump.
Key Differentiators Between Harris and Trump
- Climate Change Funding and Fracking: Harris supports climate change initiatives and banning fracking, while Trump opposes.
- AI and Data Privacy Regulation: Harris favors regulation, Trump does not.
- Corporate Taxation: Harris advocates for increased corporate taxes, Trump is against.
Kamala Harris's agenda is favorable for renewable energy markets, restricts non-regulated tech and AI growth, and supports middle-class growth through increased corporate taxation.
Conversely, Trump's agenda is beneficial for the oil market and the dollar, favors low regulation for AI and tech growth, and supports corporate tax cuts and tariffs, potentially boosting the stock market in the short term but increasing inflation risks.
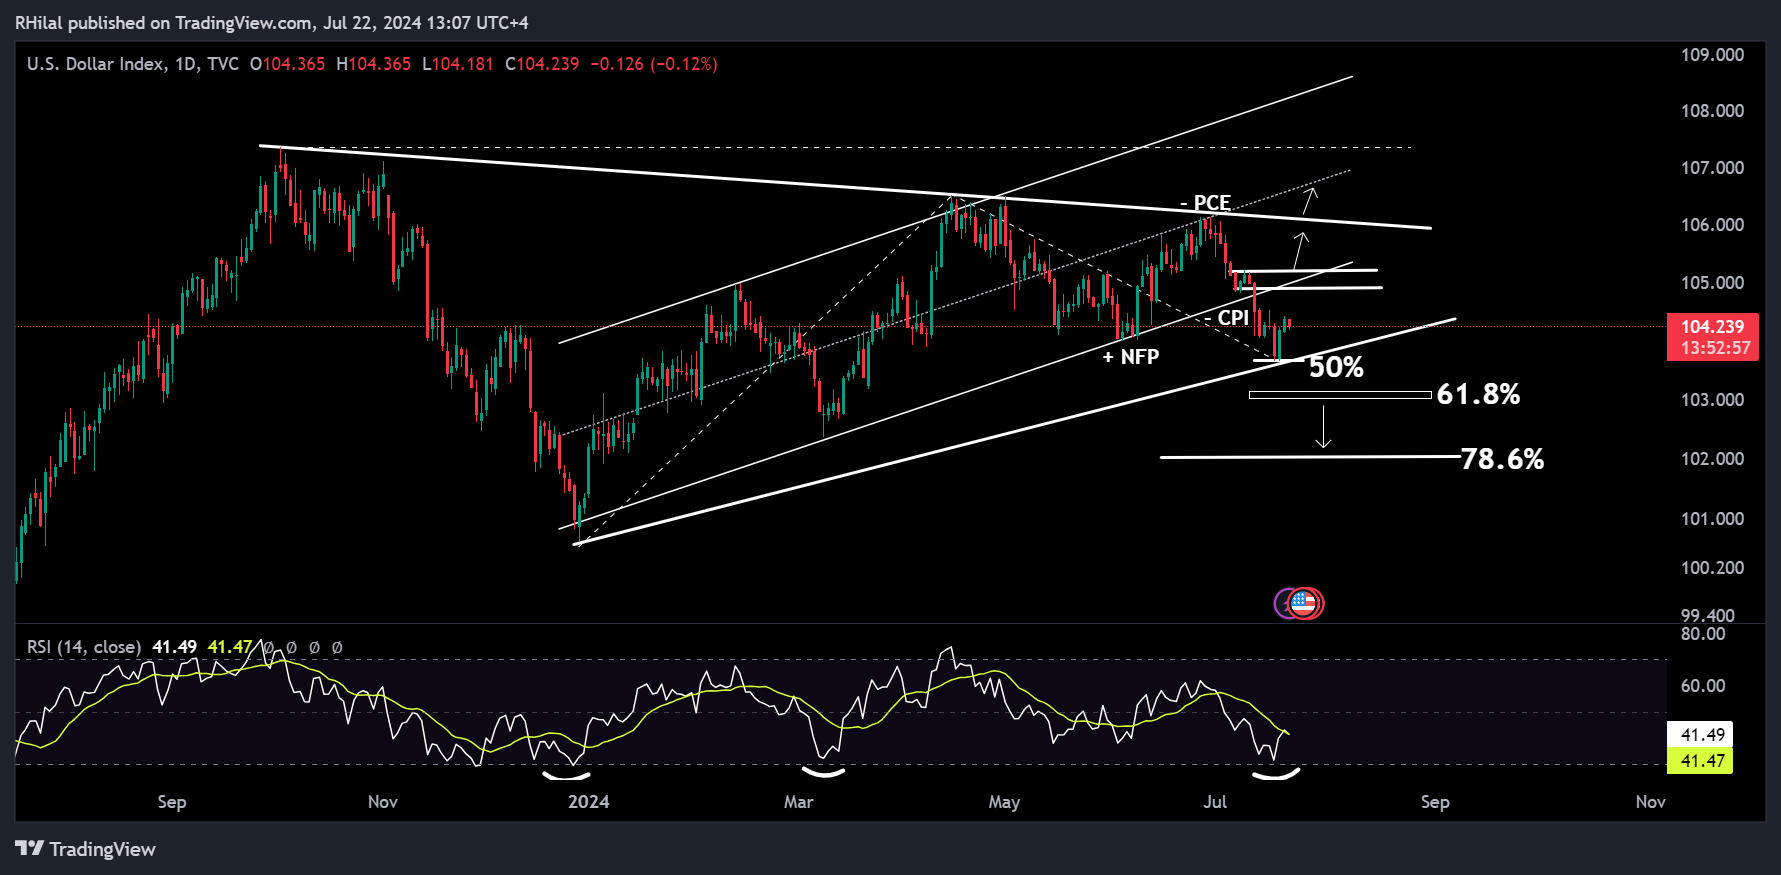
EURUSD, DXY Analysis: DXY – Daily Time Frame – Log Scale

Source: Tradingview
Amid an uncertain atmosphere with political changes, unclear dollar projections, Fed rate cut expectations, and upcoming PCE results, the DXY chart is consolidating.
Bullish Scenario
From the perspective of an oversold relative strength index, piercing candlestick pattern, and consolidation, a bullish reversal can be projected towards levels 105.20 and 106.20 respectively.
Bearish Scenario
On the downside, a break below the consolidation and the 103.65 low can drive the trend towards the potential levels of 103 and 102 respectively.
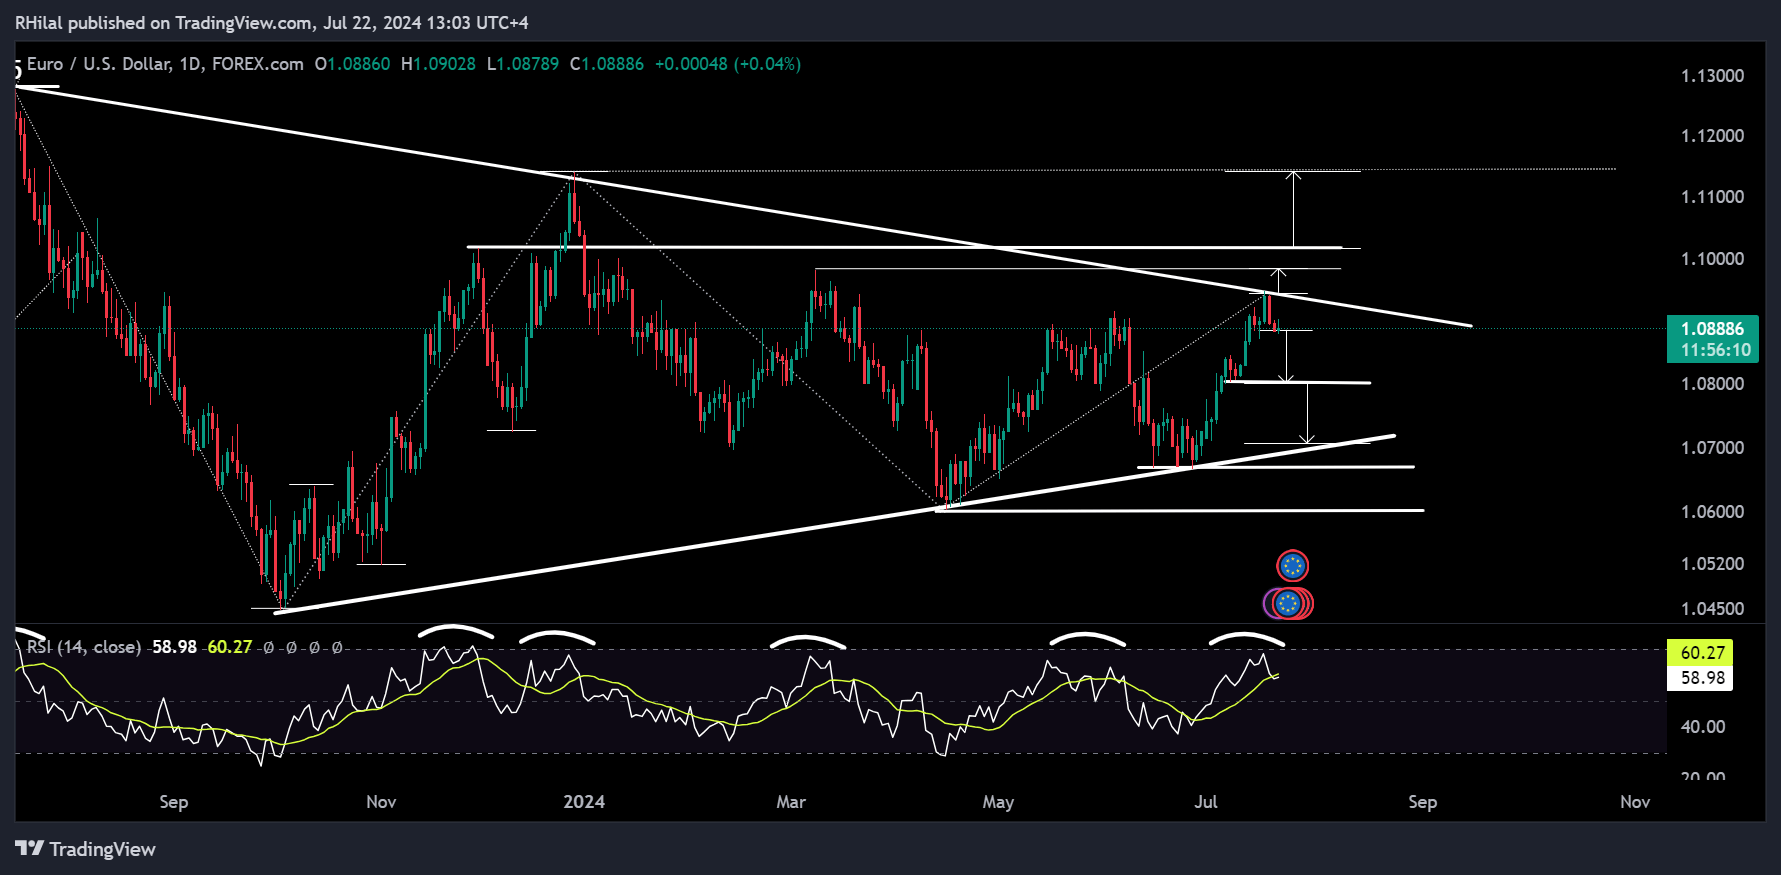
EURUSD, DXY Analysis: EURUSD – Daily Time Frame – Log Scale

Source: Tradingview
Ahead of Wednesday's PMI results, known to induce volatility in the EUR/USD charts, the following analysis is projected:
Bearish Scenario
The latest highs on the EUR/USD chart align with the resistance line connecting the highs of July and December 2023, at 1.0948. An overbought RSI, bearish engulfing pattern, and consolidation pattern suggest a potential decline towards 1.08 and 1.07.
Bullish Scenario
A break above the 1.0980 high could align with levels 1.1020 and 1.1140.
--- Written by Razan Hilal, CMT


