Key Events
- EURUSD Drops to 7-month lows
- Bitcoin eyes 100,000
- US CPI (y/y, m/m, core) and Fed Rate expectations on Wednesday
- FOMC Member Remarks between Wednesday and Thursday
- Fed Powell Remarks at the Global Perspectives Panel on Friday
Dollar’s Bull Run Against the Euro – Is This a Bull Flag?
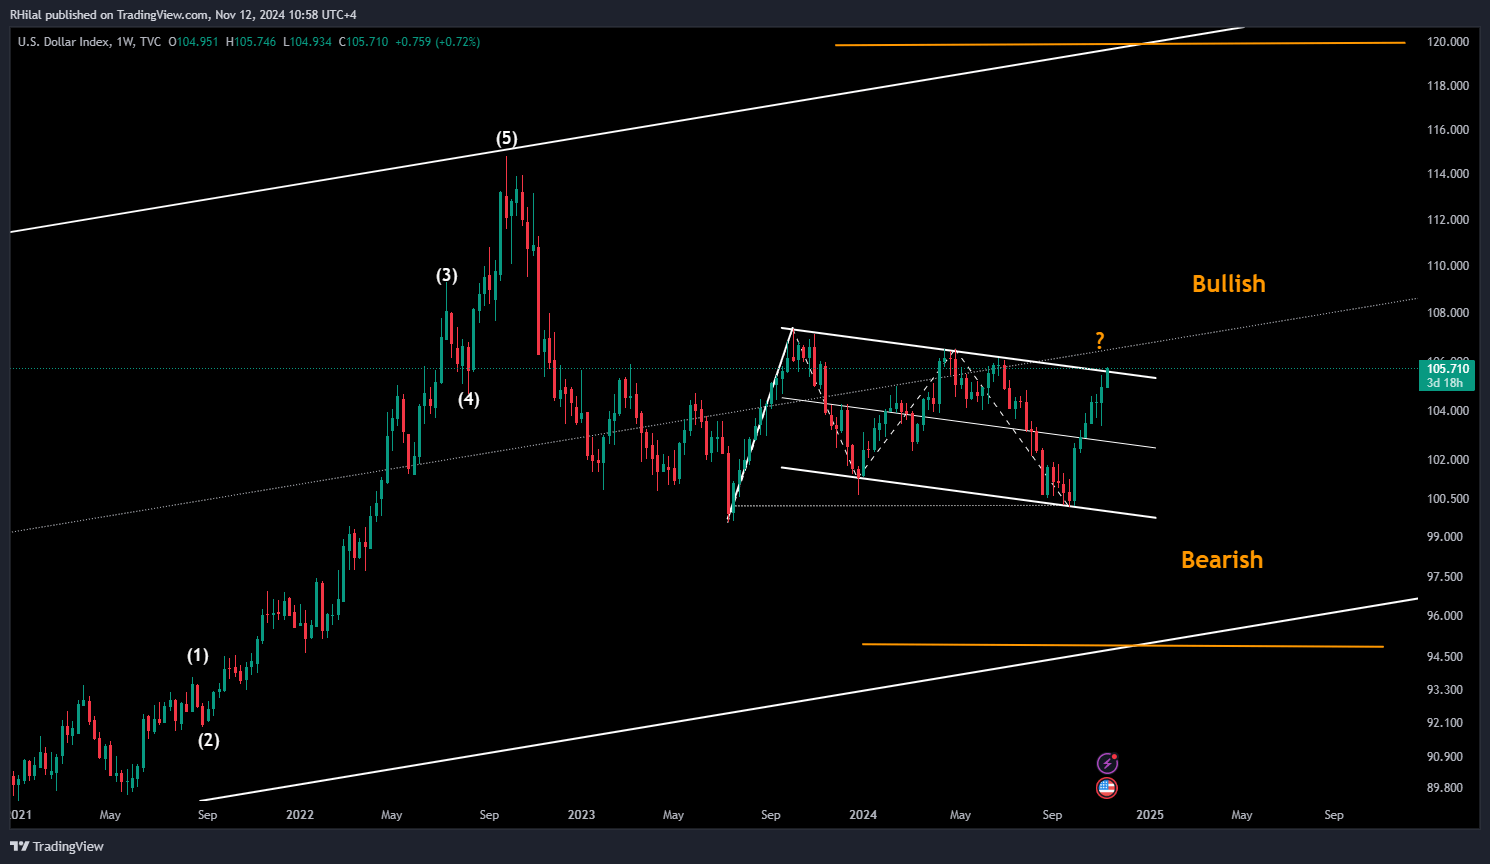
The US dollar index is hovering just below the 106-mark, at the upper border of a yearlong parallel channel. A decisive breakout above that pattern can confirm a bull flag, pushing the dollar index to 107 and EURUSD to the 1.0480 mark.
DXY – Weekly Time Frame – Log Scale

Source: Tradingview
The DXY has been trending within a primary upward channel since 2008. The current year-long channel now stands at a neutral juncture: either a drop to the channel’s lower boundary before a bull continuation, or a breakout toward a steeper rally against the markets.
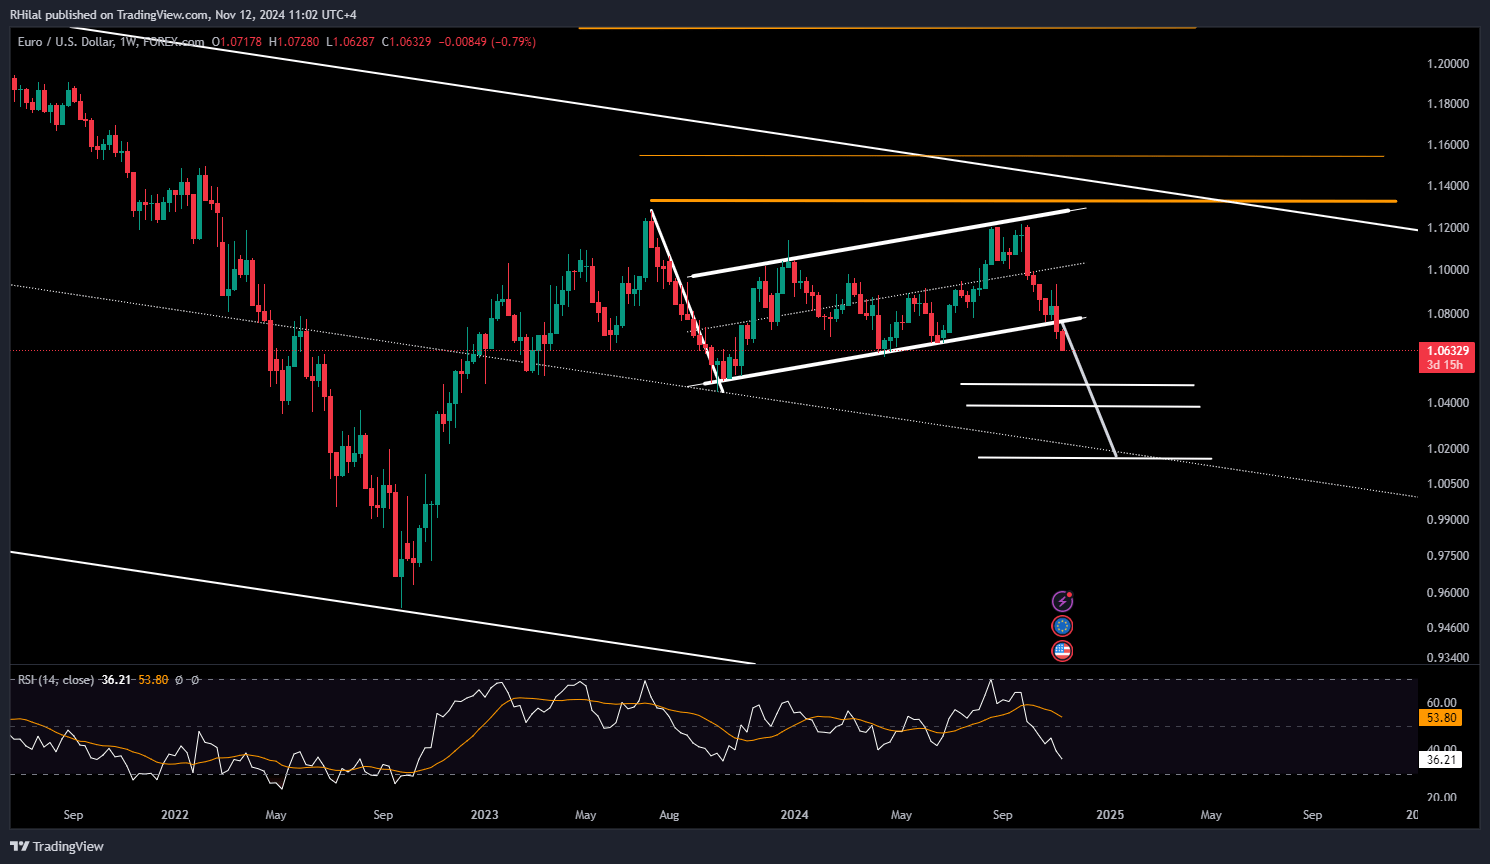
EURUSD Forecast: Weekly Time Frame – Log Scale

Source: Trading view
EURUSD recently broke below its year-long consolidation. Only a firm close above the 1.08 level might save EURUSD’s 2022 bull run. The trend now points to support at 1.05 and 1.0480. A decisive drop below 1.0480 could extend losses down to 1.01.
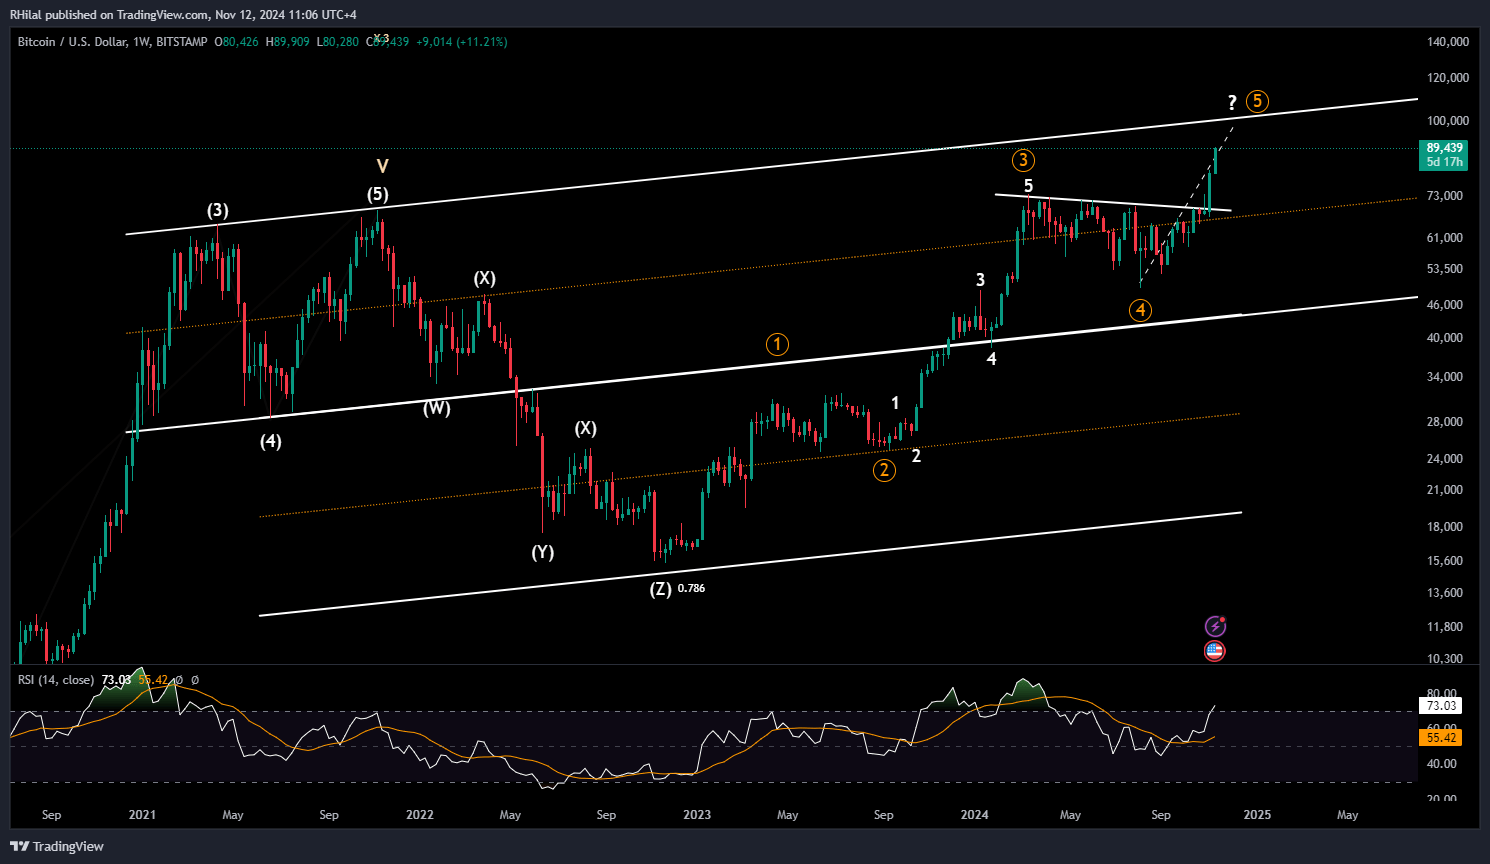
On the bright side, alongside the dollar’s bull run, bitcoin is eyeing the 100,000-markBTCUSD Forecast: Weekly Time Frame – Log Scale

Source: Trading view
From a channel analysis perspective, Bitcoin’s drop from 2021 highs traced a duplicated range towards the 15,480 low and resumed its primary uptrend. Respecting the borders of the following channel, Bitcoin is currently eyeing the upper boundary, near the 100,000 zone, defined by the trendline connecting the 2021 peaks.
Additionally, the range between 73,000 and 69,000 now serves as a support zone for any pullbacks, while a decisive close below 66,000 could lead to a sharp drop to the 50,000 level.
The hype towards a deregulated crypto environment by the Republicans is fueling that bullish momentum, and 100,000 does not seem far-fetched anymore.
--- Written by Razan Hilal, CMT on X: @Rh_waves


