Asian Indices:
- Australia's ASX 200 index rose by 28.2 points (0.39%) and currently trades at 7,283.60
- Japan's Nikkei 225 index has risen by 441.53 points (1.61%) and currently trades at 27,940.00
- Hong Kong's Hang Seng index has risen by 178.53 points (0.87%) and currently trades at 20,607.99
- China's A50 Index has risen by 12.52 points (0.09%) and currently trades at 13,541.93
UK and Europe:
- UK's FTSE 100 futures are currently up 25 points (0.31%), the cash market is currently estimated to open at 7,969.04
- Euro STOXX 50 futures are currently up 25 points (0.59%), the cash market is currently estimated to open at 4,265.59
- Germany's DAX futures are currently up 60 points (0.39%), the cash market is currently estimated to open at 15,387.64
US Futures:
- DJI futures are currently down -18 points (-0.05%)
- S&P 500 futures are currently down -5.25 points (-0.13%)
- Nasdaq 100 futures are currently down -24.25 points (-0.2%)
Japan’s inflation may have peaked:
Tokyo’s inflation put in a surprisingly low number, with CPI falling to 3.4% y/y from 4.4%, and core CPI fell to 3.3% y/y from 4.3%. And as Tokyo is a great lead for Japan’s nationwide inflation, it’s a pretty strong signal that inflation may have peaked. Under normal circumstances, this would send the respective currency lower (in this case the yen) as it likely signals a les hawkish central bank. But what good is that when the BOJ are already at an ultra-easy stance? But whilst this means little for the BOJ’s monetary policy, it is at least a minor victory for global disinflation.

ISM Non-manufacturing (services) report in focus:
Depending on how you look at it, good data is not always good to see. And that’s what could make today’s ISM report the more interesting if it comes in hot. Last month we saw a solid rebound and expansion for the services sector, alongside a strong rebound with new orders. And that’s good, right? Well, not if you want lower interest rates. Inflation remains elevated, the Fed remain hawkish, which means another strong ISM report simply provides more reason for the Fed to hike by 25 or even 50bps in March.

But another metric to keep a close eye on is ‘prices paid’. Services inflation remains a thorn in the side for the Fed, and you can see why when you see how elevated the ISM services ‘prices paid’ index has remained since the pandemic. But it will be even more closely watched today as the recent ISM manufacturing report showed a surprise expansion for prices paid. Therefore, if we’re to see the services prices rise alongside stronger ISM and new orders, it solidifies the case for a more hawkish Fed and stronger US dollar. So how good do you want it? Be careful what you with for.
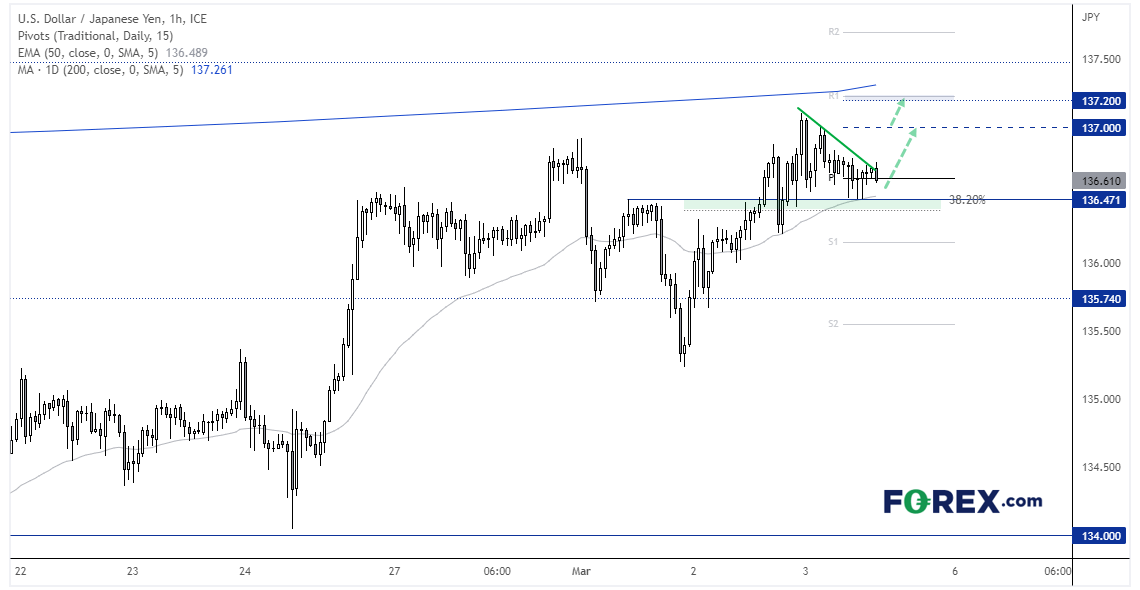
USD/JPY 1-hour chart:

USD/JPY has been grinding higher on the daily chart, inching its way towards the 200-day MA. It’s a key level the world is watching, and one that will more than likely cap as resistance. At least initially. But it does appear that it wants to have another leg higher, which could provide a near-term bullish opportunity into the key level.
Prices have retraced from this week’s high but found support above a prior swing high, the 50-hour MA and 38.2% Fibonacci ratio. Prices are currently meandering around the daily pivot point, but if momentum turns higher then our bias remains bullish above 136.40 ad for an initial move to 137, a break above which brings 137.20 / 200-day MA into focus.
Economic events up next (Times in GMT)

-- Written by Matt Simpson
Follow Matt on Twitter @cLeverEdge


