Broadcom Q3 earnings preview
Broadcom is due to release earnings on September 5th. The results come as the share price has outperformed this year, surging by more than 30% year to date. In fact, with a market cap of $772 billion, Broadcom now accounts for 2.2% of the NASDAQ, overtaking Tesla's 2% with a market cap of $713 billion.
Much of Broadcom’s share price rally has been tied to the company's improving demand growth trajectory as the AI boom ripples out into most chipmakers. Investors are betting, considering that a vast quantity of chips will be needed to power an AI-driven future.
Q3 expectations are for EPS of $1.22, a 15.4% year-on-year rise on revenue of $12.96 billion, marking a 46.7% increase. A large portion of that revenue growth is set to come from its VMWare acquisition. Meanwhile, the core semiconductor business is only expected to grow 6.8% to $7.4 billion.
How to trade Broadcom’s earnings?
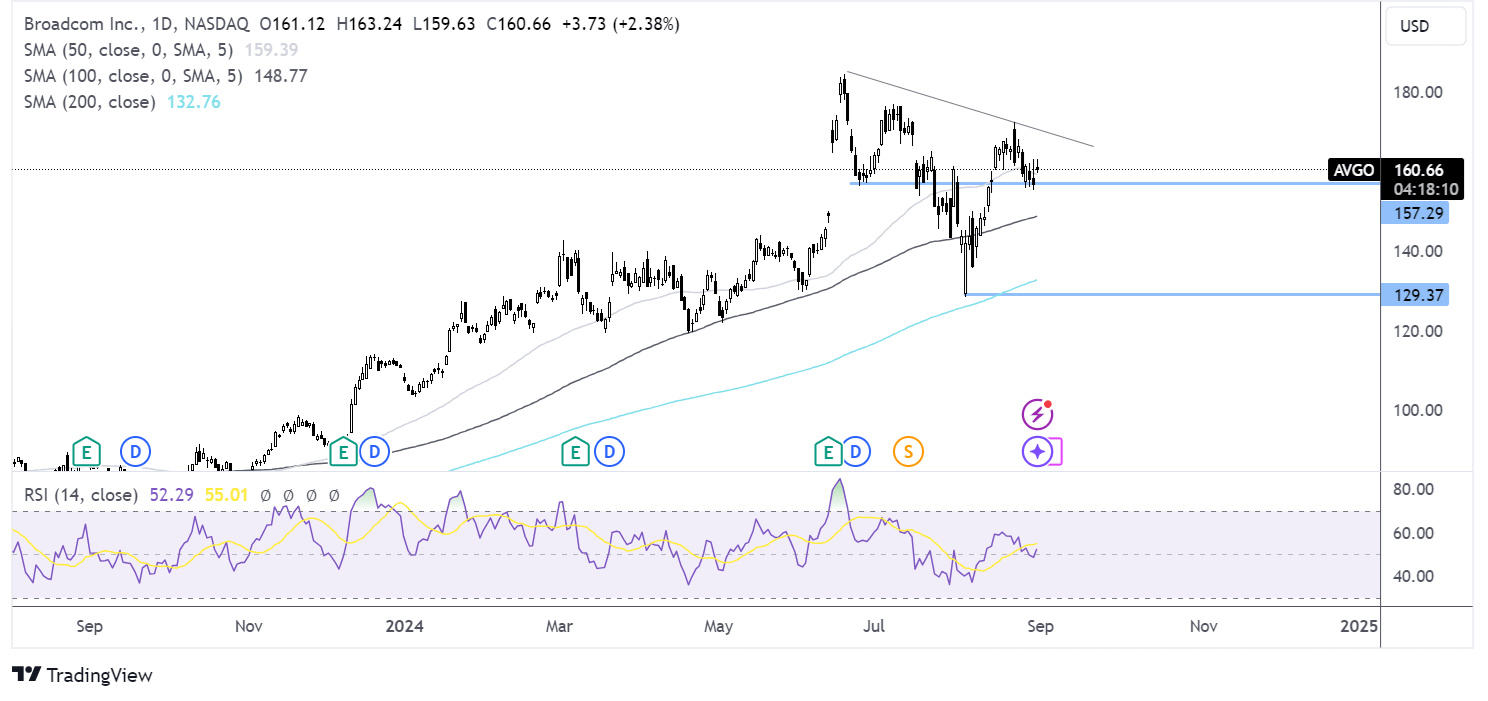
Broadcom trades below its falling trendline. The price is testing resistance at 160. Should sellers break down this support, a test of 148, the 100 SMA could be on the cards. Should supports at 160 hold; buyers could look to rise above the falling trendline at 170.

Dollar Tree Q2 earnings preview
Dollar Tree is due to report Q2 earnings on September 4th. Wall Street expects EPS of $1.04, a 14.3% increase compared to the same period last year, while revenues are expected to rise 2.5% to $7.51 billion. The results from the discount retailer outlet come after fellow discounter Dollar General’s shares crashed 25% last week after missing expectations on both the top and bottom lines.
The current climate is proving challenging amid rising concerns that poorer US consumers who shop at discount retailers are running out of money. Low-income American households are more financially constrained than six months ago after a difficult few years of high inflation, rising prices, and high interest rates. Low-income shoppers are still very fragile.
However, the situation could start to improve soon, as inflation has fallen to 2.9% in the US, its lowest level since 2021. The largest US retailer, Walmart, recently reported sales growth in its latest earnings. The market will be watching closely for comments regarding the outlook.
How to trade Dollar Tree’s earnings?
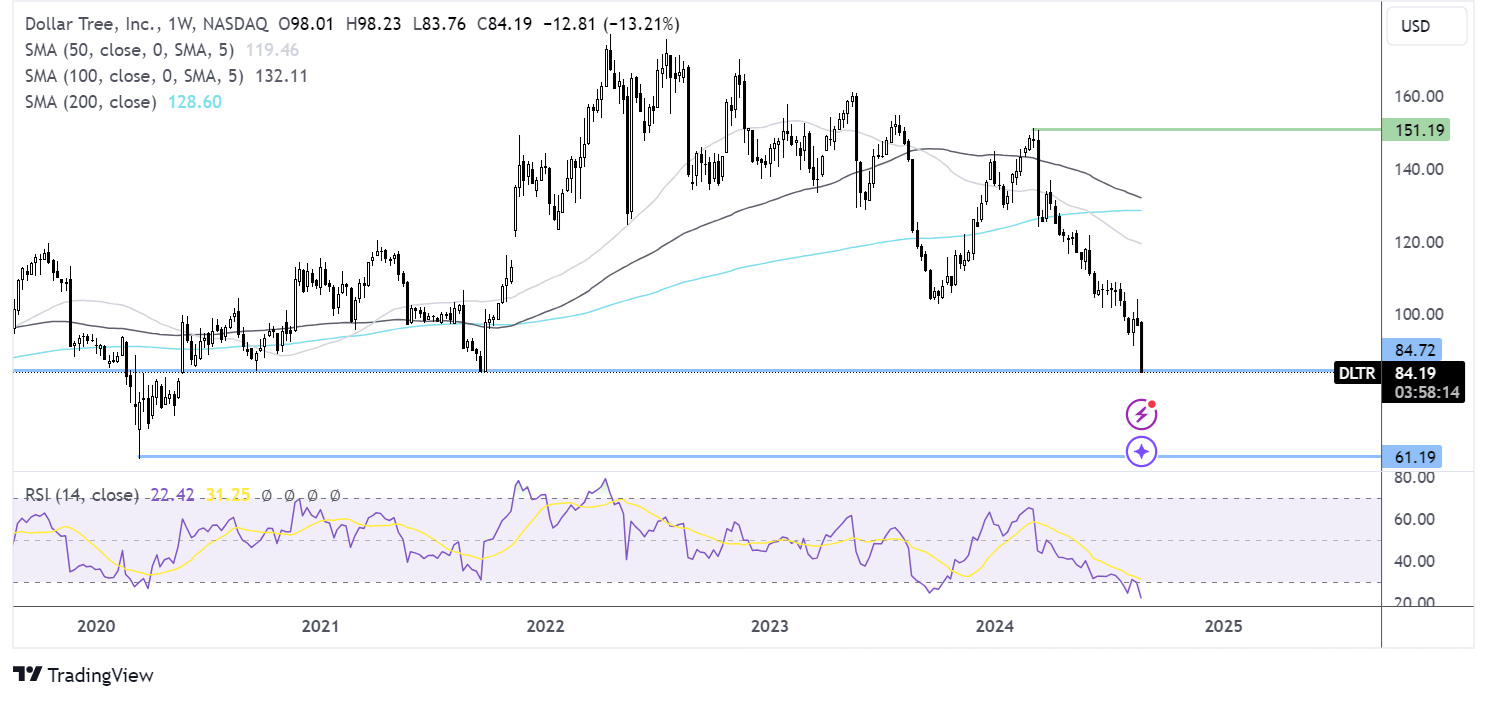
On the weekly chart, Dollar Tree has fallen across 2024 and is testing a key support level of around 84.00, the 2021 low. The bearish engulfing candle is an ominous sign. However, sellers would need to break below the 84.00 support to open the door to 60.00, the 2020 low.

Berkeley Group trading update
UK housebuilder Berkeley Group is due to release a trading update on September 6. The results come as the share price trades 7% higher across the past six months but has remained unchanged over the past month.
Housebuilders have had a challenging few years. However, the outlook could be starting to improve as the Bank of England reduced interest rates by 25 basis points in August and is expected to cut interest rates again, possibly by 25 basis points in the November meeting. A lower interest rate environment could help the mortgage market improve, supporting demand and lifting house prices.
According to Nationwide’s house price index, UK house prices are growing at the fastest pace since December 2022. Hose prices are still around 3% off their December 2022 high, but they are still a good backdrop for housebuilders.
In June, Berkeley noted that trading had been subdued, and they said that it is expected to continue in the near term. Reservations are down by 1/3 year on year while prices remain broadly stable.
Investors will be keen to see whether Berkley Group sees the outlook improving in light of BoE rate cuts and rate cut expectations and the new Labour government. The market will also be looking for further details about its move into the build-to-rent market.
How to trade Berkeley Group's update?
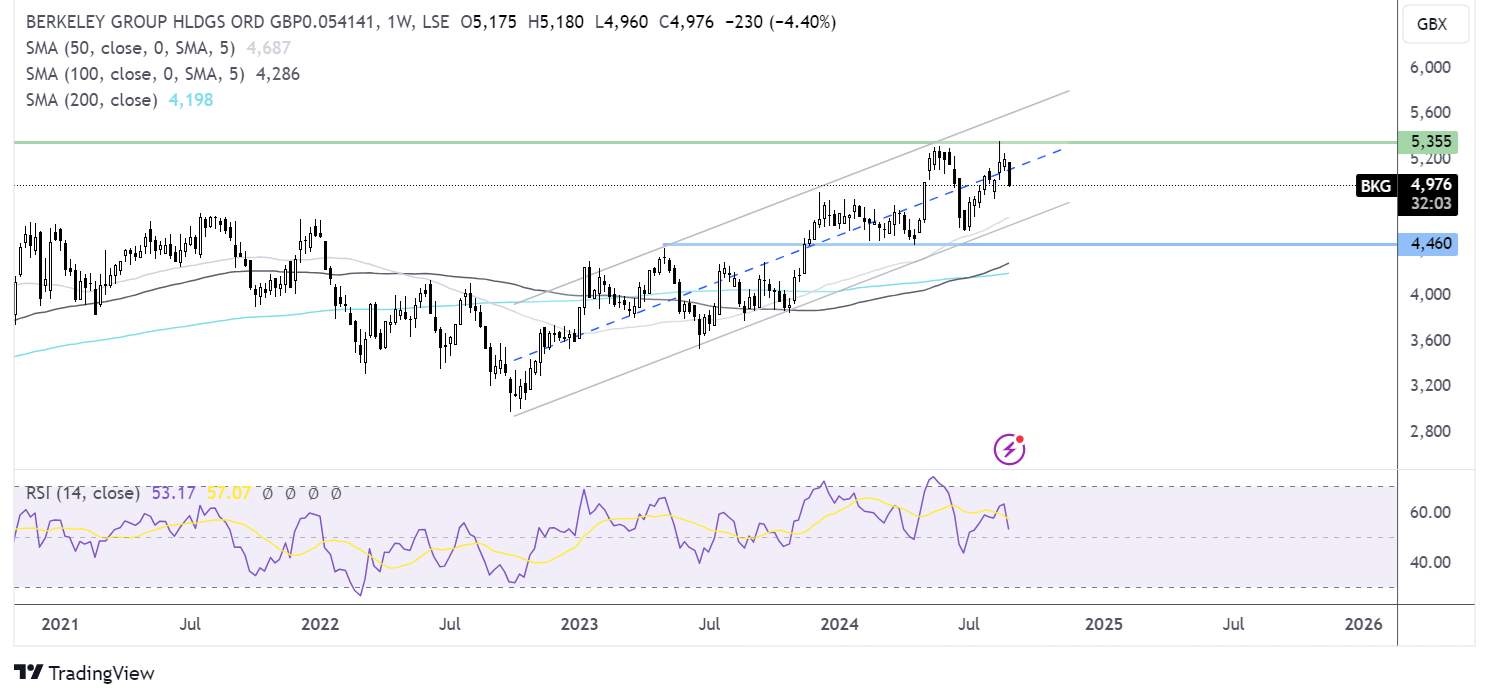
Berkeley Group trades within a rising channel on the weekly chart. The price recently reached an ATH on August 12 before correcting lower.
The rising trendline and lower band of the channel offer support at 4660, and below that, the 4420 2023 high comes into play.
Arise above 5365 takes the share price to fresh all-time highs.


