On Thursday, December 12, 2024, two major U.S. corporations—Broadcom Inc. (NASDAQ: AVGO) and Costco Wholesale Corporation (NASDAQ: COST)—are scheduled to release their earnings reports.
Broadcom Inc. (AVGO): Q4 and Fiscal Year 2024 Earnings
Broadcom, a global leader in semiconductor and infrastructure software solutions, will announce its fourth-quarter and fiscal year 2024 financial results after the market closes on December 12, 2024. The company's management will host a conference call at 2:00 p.m. Pacific Time to discuss the results and business outlook.
In the previous quarter, Broadcom reported earnings per share (EPS) of $1.24, surpassing analysts' consensus estimate of $1.20. The company's revenue for that quarter rose to $13.07 billion, reflecting a 47.3% year-over-year increase.
For the upcoming report, analysts anticipate an EPS of $1.39, indicating a 25.23% year-over-year increase.
This optimism is driven by Broadcom's significant role in the artificial intelligence (AI) sector, supplying silicon for AI processing, networking, and data storage. The company's stock has surged 64% in 2024, outpacing the Nasdaq Composite's 33% gain, largely due to increased AI data center spending.
However, some analysts express caution regarding potential slowdowns in orders from major clients, such as Google's AI division, which could impact near-term sales. Despite these concerns, Broadcom's diversified revenue streams, including software products and robust profit margins on chips, have contributed to strong cash flows, with free cash flow increasing by $3.7 billion to $21 billion in fiscal 2024.
How to trade Broadcom earnings

1. Current Price Action and Trend:
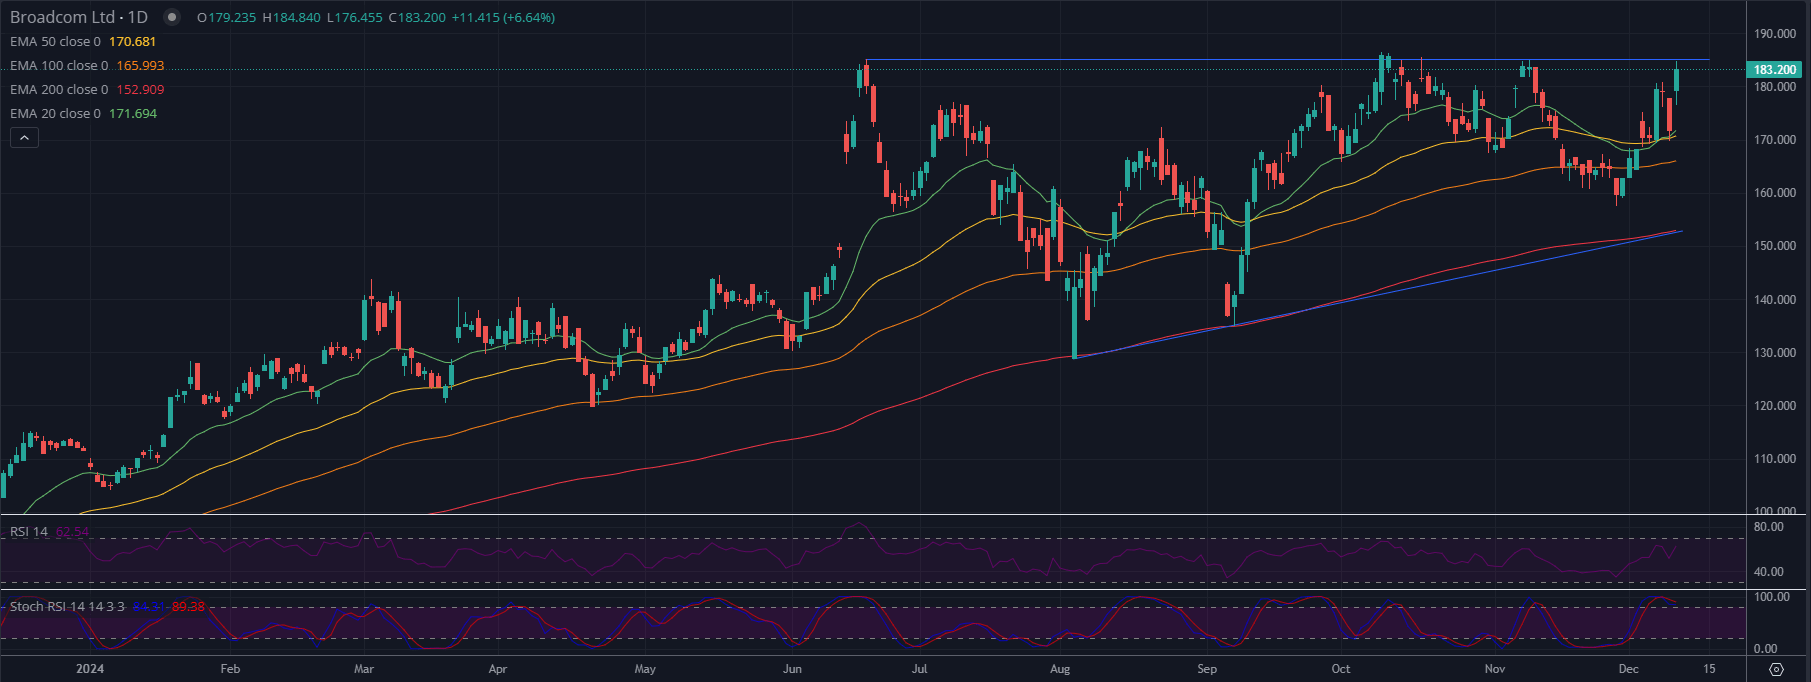
- Broadcom is trading at $183.20, showing a strong upward move with a daily gain of +6.64%.The price has broken above a critical resistance zone, suggesting bullish momentum and the potential for further upside.
2. Support and Resistance Levels:
- Resistance:
- Immediate resistance is near $185.00, which aligns with the recent breakout zone.
- A successful breakout above $185.00 could target the next significant level at $190.00.
- Support:
- Immediate support lies at $171.69 (EMA 20), which acts as dynamic support for the ongoing rally.
- Further support is at $170.68 (EMA 50), which provides medium-term downside protection.
- The EMA 200 at $152.91 serves as a long-term support level.
3. Moving Averages:
- The stock is trading well above all major moving averages, confirming a strong bullish trend.
4. RSI and Stochastic RSI:
- The RSI is at 62.54, reflecting bullish momentum but not yet overbought, leaving room for further upside.
- The Stochastic RSI is at 89.28, indicating overbought conditions. This suggests that the stock may consolidate or face short-term resistance before continuing higher as the fast blue line is crossing below the slow red line.
Thesis:
Scenario 1: Bullish Continuation:
- If Broadcom breaks and sustains above $185.00, it could target $190.00 and potentially higher.
- Sustained momentum above $185.00 would confirm the breakout and strengthen the bullish trend.
Scenario 2: Short-term Pullback:
- Overbought Stochastic RSI conditions suggest a potential pullback to $171.69 (EMA 20) or $170.68 (EMA 50).
- A deeper correction below $170.68 could lead to further downside toward $165.99 (EMA 100).
Costco Wholesale Corporation (COST): Q1 Fiscal 2025 Earnings
Costco, a leading global retailer, is set to release its first-quarter fiscal 2025 earnings after the market closes on December 12, 2024. The company will hold a conference call at 1:15 p.m. Pacific Time to discuss the results.
In the previous quarter, Costco reported an EPS of $5.15, exceeding the consensus estimate of $5.05. The company's net sales for the 16-week fourth quarter were $78.2 billion, a 1.0% increase compared to the same period the previous year.
Analysts expect Costco to report an EPS of $3.79 for the upcoming quarter, up from $3.48 in the same quarter last year.
This anticipated growth reflects Costco's strong performance in enhancing its e-commerce capabilities and creating new revenue streams, such as digital advertising and fulfillment services. The company's focus on technology and efficient operations has resonated with consumers, especially amid economic uncertainties marked by inflation and fluctuating consumer sentiment.
How to trade Costco earnings

Trend Analysis
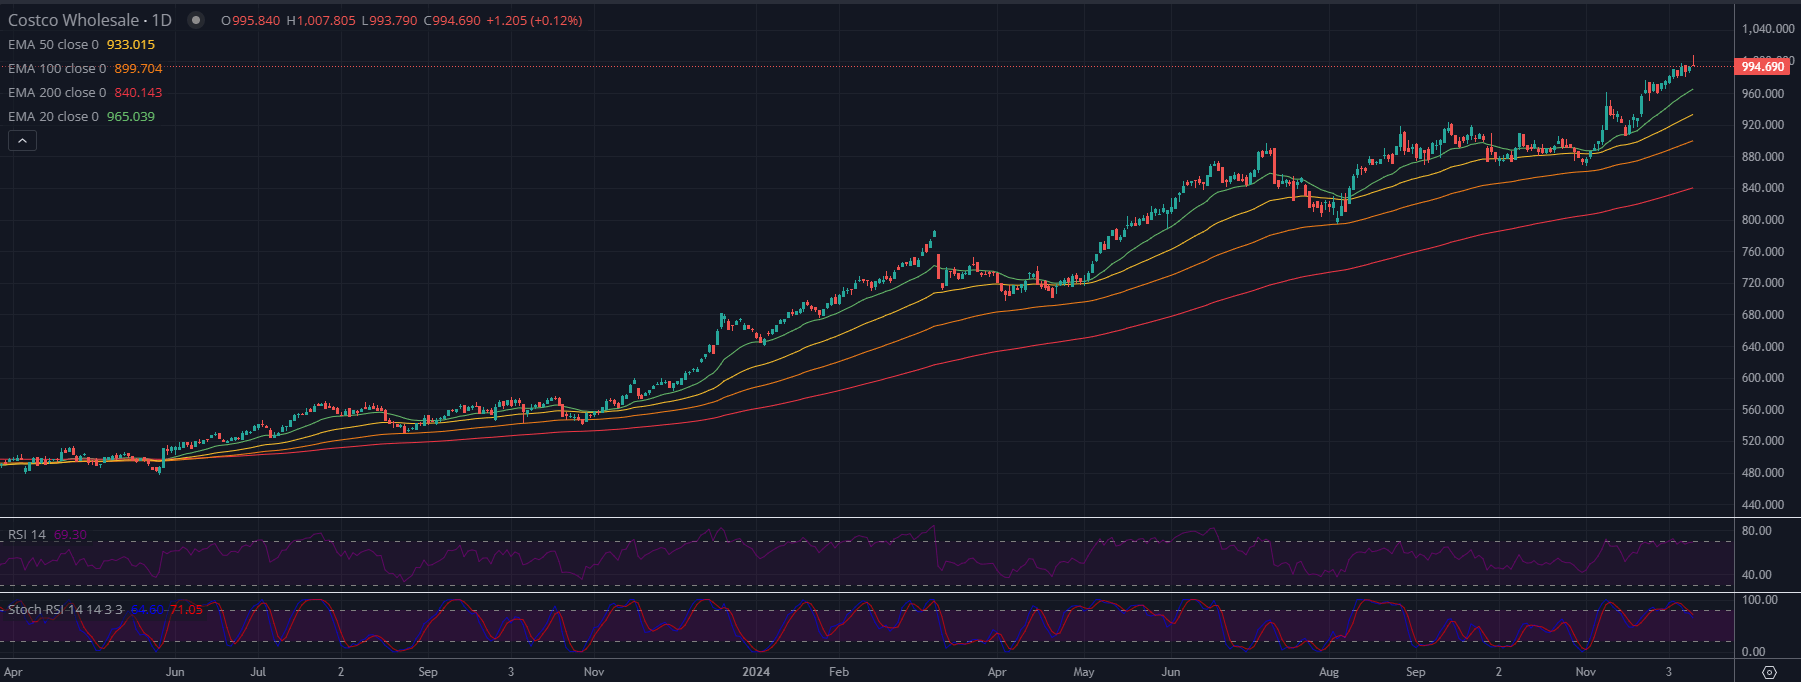
- General Trend: The chart suggests a strong upward trend. Costco's stock has been steadily climbing, supported by all the major moving averages and recent higher highs and higher lows.
- Momentum: The stock price is above its 20-day, 50-day, 100-day, and 200-day Exponential Moving Averages (EMA), indicating a bullish alignment across short, medium, and long-term timeframes.
Moving Averages
- 20-day EMA (short-term): The price is above this level, suggesting strong short-term momentum.
- 50-day EMA (medium-term): Acting as solid support during pullbacks, this EMA confirms sustained bullishness.
- 100-day and 200-day EMA (long-term): The price above these EMAs indicates strong institutional buying and a bullish long-term trend.
Relative Strength Index (RSI)
- Current Level (~69): RSI is approaching overbought territory (above 70), indicating strong buying momentum. However, this could also signal a potential short-term pause or pullback as the price consolidates.
Stochastic RSI
- Overbought Conditions (~71): The stochastic RSI is in the overbought zone, suggesting that the stock may be due for a short-term cooling-off period before resuming its upward trajectory.
Key Levels
- Support Levels:
- $965 (20-day EMA): Strong support for short-term pullbacks.
- $933 (50-day EMA): A critical level for medium-term corrections.
- Resistance Levels:
- $1,000: A psychological level, which the stock seems to be testing.
- $1,040: Potential near-term resistance if momentum continues.
Volume and Market Sentiment
- While volume data is not visible in the image, a sustained breakout above $1,000 accompanied by strong volume could confirm further upside. Conversely, weak volume at these levels may indicate a lack of conviction.
Outlook
- Bullish Case: If Costco maintains support above the 20-day EMA and clears the $1,000 psychological barrier, it could extend its rally toward the $1,040 level or higher.
- Bearish Case: A failure to sustain above $1,000, combined with overbought RSI and stochastic indicators, could lead to a short-term pullback toward $965 or even $933.
Conclusion
Costco's chart displays a strong bullish trend supported by technical indicators. However, caution is advised as overbought conditions suggest the possibility of short-term consolidation or a minor pullback. For investors or traders, keeping an eye on volume and price action near key levels is crucial.


