Key Events
- Chinese Manufacturing PMIs: Chinese PMIs rose above the expansionary 50 mark for the first time since April 2024, providing some optimism but with additional data needed to improve the crude demand outlook from China’s economy.
- ADP Non-Farm Payrolls: The latest ADP report showed a positive change of 233k, the highest increase since August 2023. Friday’s non-farm payroll data is anticipated to further shape monetary policy expectations and its effects on various markets, including oil.
- Middle East Negotiations: Talks continue ahead of the US elections, but no resolutions have been reached yet, keeping supply risks elevated.
- Impact of US Elections
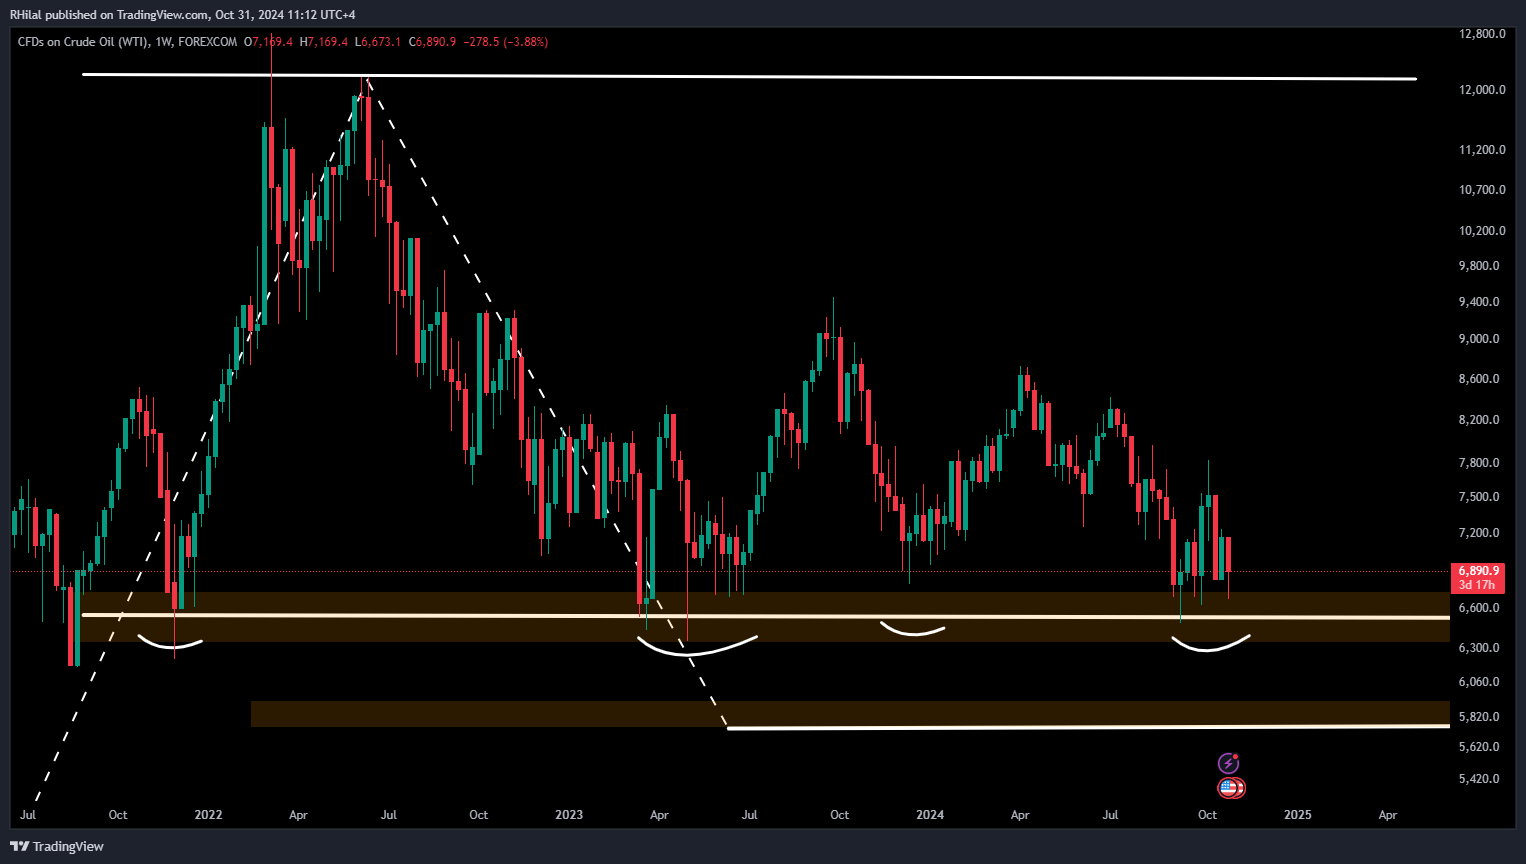
Where is the 2021 Support?

Source: Tradingview
The lows recorded in December 2021, covering the 67-64 price range, have established a crucial support level that has held through 2023’s lows in March to June, as well as in December 2023 and September-October 2024.
This support zone has aligned with significant market events over nearly three years and is expected to maintain its volatile, supportive effect on oil prices until a confirmed close below the 64-mark occurs. Such a break could intensify bearish scenarios, particularly as global shifts toward renewable energy progress.
Crude Oil Forecast: 3-Day Time Frame – Log Scale

Source: Tradingview
Oil prices recently rebounded from the critical support zone at 66.70, rising back to 69. Volatility within the 64-67 zone is likely to continue until a decisive breakout or reversal takes place.
The RSI indicator’s recent rebound from oversold levels has formed a possible head-and-shoulders pattern below the neutral zone, with the breakout target aligning with the oversold threshold. If this head-and-shoulders pattern breaks below the 64-mark, the next support is anticipated around the 60-58 range.
On the upside, resistance is likely at levels 70 and 72 before any potential move toward the 75-76 range, which would align with the 50-period simple moving average.
— Written by Razan Hilal, CMT – on X: @Rh_waves


