British Pound Technical Outlook: GBP/USD Short-Term Trade Levels
- British Pound plunges to fresh monthly low- down 4.4% off September / yearly high
- GBP/USD now testing key pivot zone with major technical support just lower
- Sterling risk for exhaustion / price inflection into monthly cross- Major event risk on tap
- Resistance 1.30, 1.3045 (key), 1.31- Support 1.2857-1.29, 1.2731/77 (key), 1.2613
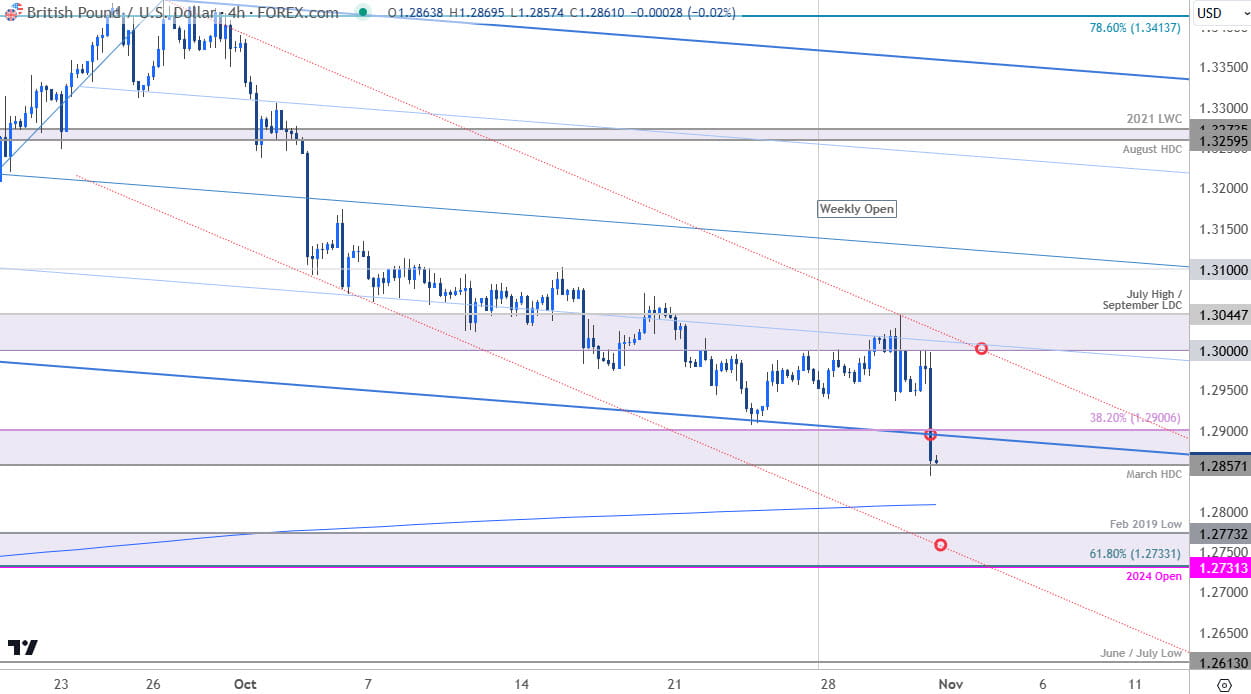
An outside-day reversal off resistance takes GBP/USD into technical support today with the bears threatening to break the April uptrend. While the medium-term threat remains weighted to the downside, the immediate decline may be vulnerable into the monthly cross with Non-Farm Payrolls, the US election, and the Fed / BoE rate decisions on tap over the next week. Battle lines drawn on the GBP/USD short-term technical charts int the November open.
Review my latest Weekly Strategy Webinar for an in-depth breakdown of this Sterling technical setup and more. Join live on Monday’s at 8:30am EST.British Pound Price Chart – GBP/USD Daily

Chart Prepared by Michael Boutros, Sr. Technical Strategist; GBP/USD on TradingView
Technical Outlook: In my last British Pound Short-term Outlook, we noted that a 3% decline off the yearly highs had taken , “at 1.3000/45- a region defined by September swing low, the low-day close (LDC), and the July high. Looking for a possible reaction off this mark today…” GBP/USD held this support zone for five-days before breaking lower with the decline now threatening the April uptrend.
A break of the weekly opening-range today keeps the immediate focus on this test of support at the March high-day close (HDC) / 38.% retracement at 1.2857-1.2906- a close below this threshold is needed to keep the bulls in control towards the 200-day moving average (currently ~1.2810) and key technical support just lower at 1.2731/73- a region defined by the objective yearly open, the 61.8% retracement of the yearly range, and the February 2019 swing low. Look for a larger reaction there IF reached.
British Pound Price Chart – GBP/USD 240min

Chart Prepared by Michael Boutros, Sr. Technical Strategist; GBP/USD on TradingView
Notes: A closer look at Sterling price action shows GBP/USD trading within the confines of an embedded channel extending off the late-September high with lower parallel further highlighting key support into the 2024 yearly open. Initial resistance now eyed back at 1.3000 with near-term bearish invalidation set to the July high / September low-day close at 1.3045.
Note that a break below the yearly-open could fuel another bout of accelerated losses with initial support objectives eyed at the June / July lows at 1.2613 and the 61.8% retracement of the late-2023 advance at 1.2571.
Bottom line: GBP/USD is attempting to break below near-term technical hurdle here with more significant support seen just lower. The immediate focus is on todays close with respect to 1.2857. From at trading standpoint, a good zone to reduce short-exposure / lower protective stops- rallies should be limited to the weekly high IF price is heading lower on this stretch with a close below this pivot zone exposing a run towards the yearly open.
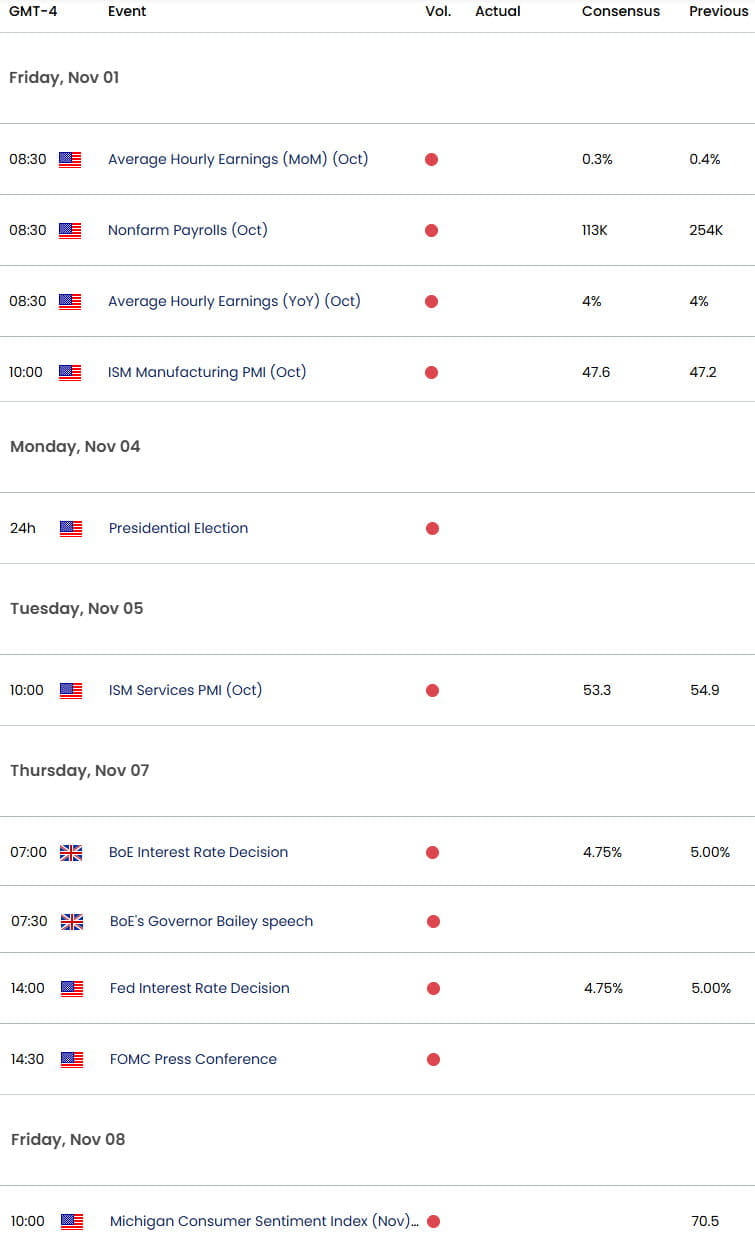
Keep in mind Non-Farm Payrolls are on tap into the close of the week with US elections and the Federal Reserve & Bank of England interest rate decisions on tap next week. Stay nimble here into the monthly cross and watch the weekly closes for guidance. Review my latest British Pound Weekly Forecast for a closer look at the longer-term GBP/USD technical trade levels.
Key GBP/USD Economic Data Releases

Active Short-term Technical Charts
- Euro Short-term Outlook: EUR/USD Rebound Tempts Breakout Ahead of NFP
- US Dollar Short-term Outlook: USD Bulls Relent at Resistance
- Australian Dollar Short-term Outlook: AUD/USD Bears Charge 6600
- Canadian Dollar Short-term Outlook: USD/CAD at Resistance- BoC on Tap
- Gold Short-term Outlook: XAU/USD October Range Breakout Imminent
--- Written by Michael Boutros, Sr Technical Strategist with FOREX.com
Follow Michael on X @MBForex


