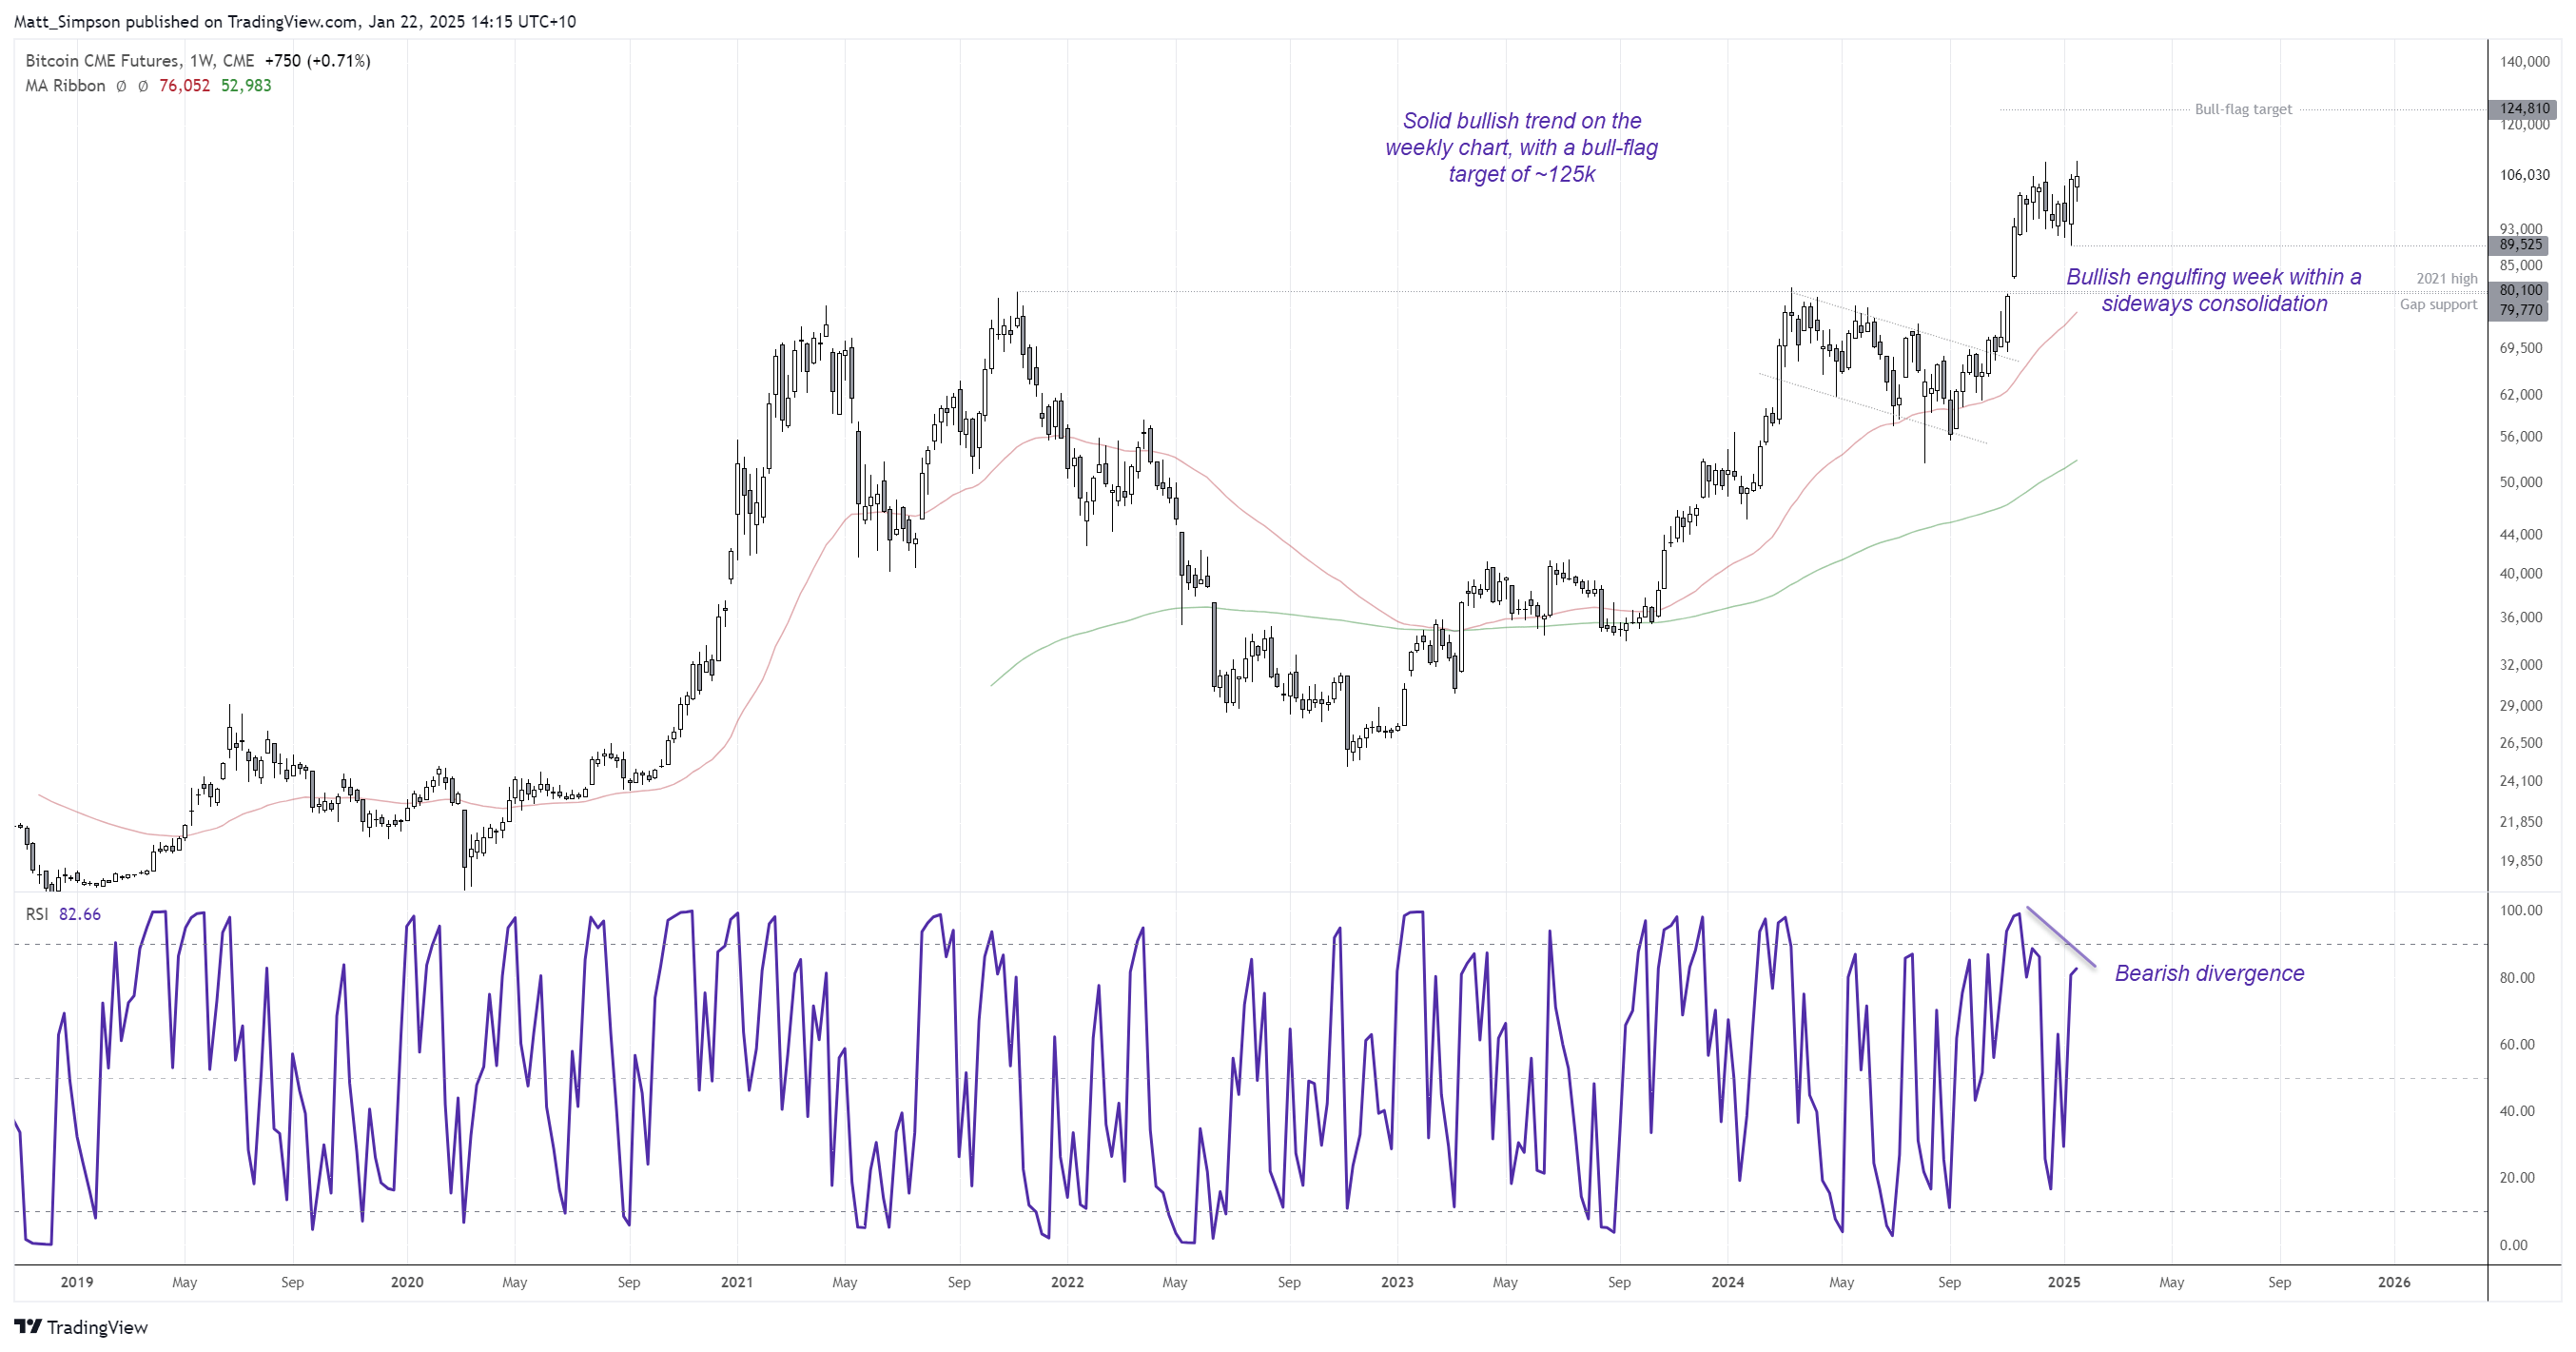
The weekly chart shows a solid bullish trend, even if prices have effectively traded sideways since it reached the magical 100k level. That has taken some wind out of bullish sails, but it can also be argued that bears are not exactly piling into this market to drive it lower. I therefore suspect pullbacks from here to be shallow.

Bulls should take note of the bearish divergence forming on the weekly RSI (2). While this does not signal a deep correction, it does show a loss of bullish momentum over the near term. Still, a bullish engulfing candle formed last week, so perhaps bulls will be happy with a minor retracement within last week’s range in anticipation of a break to a new high.
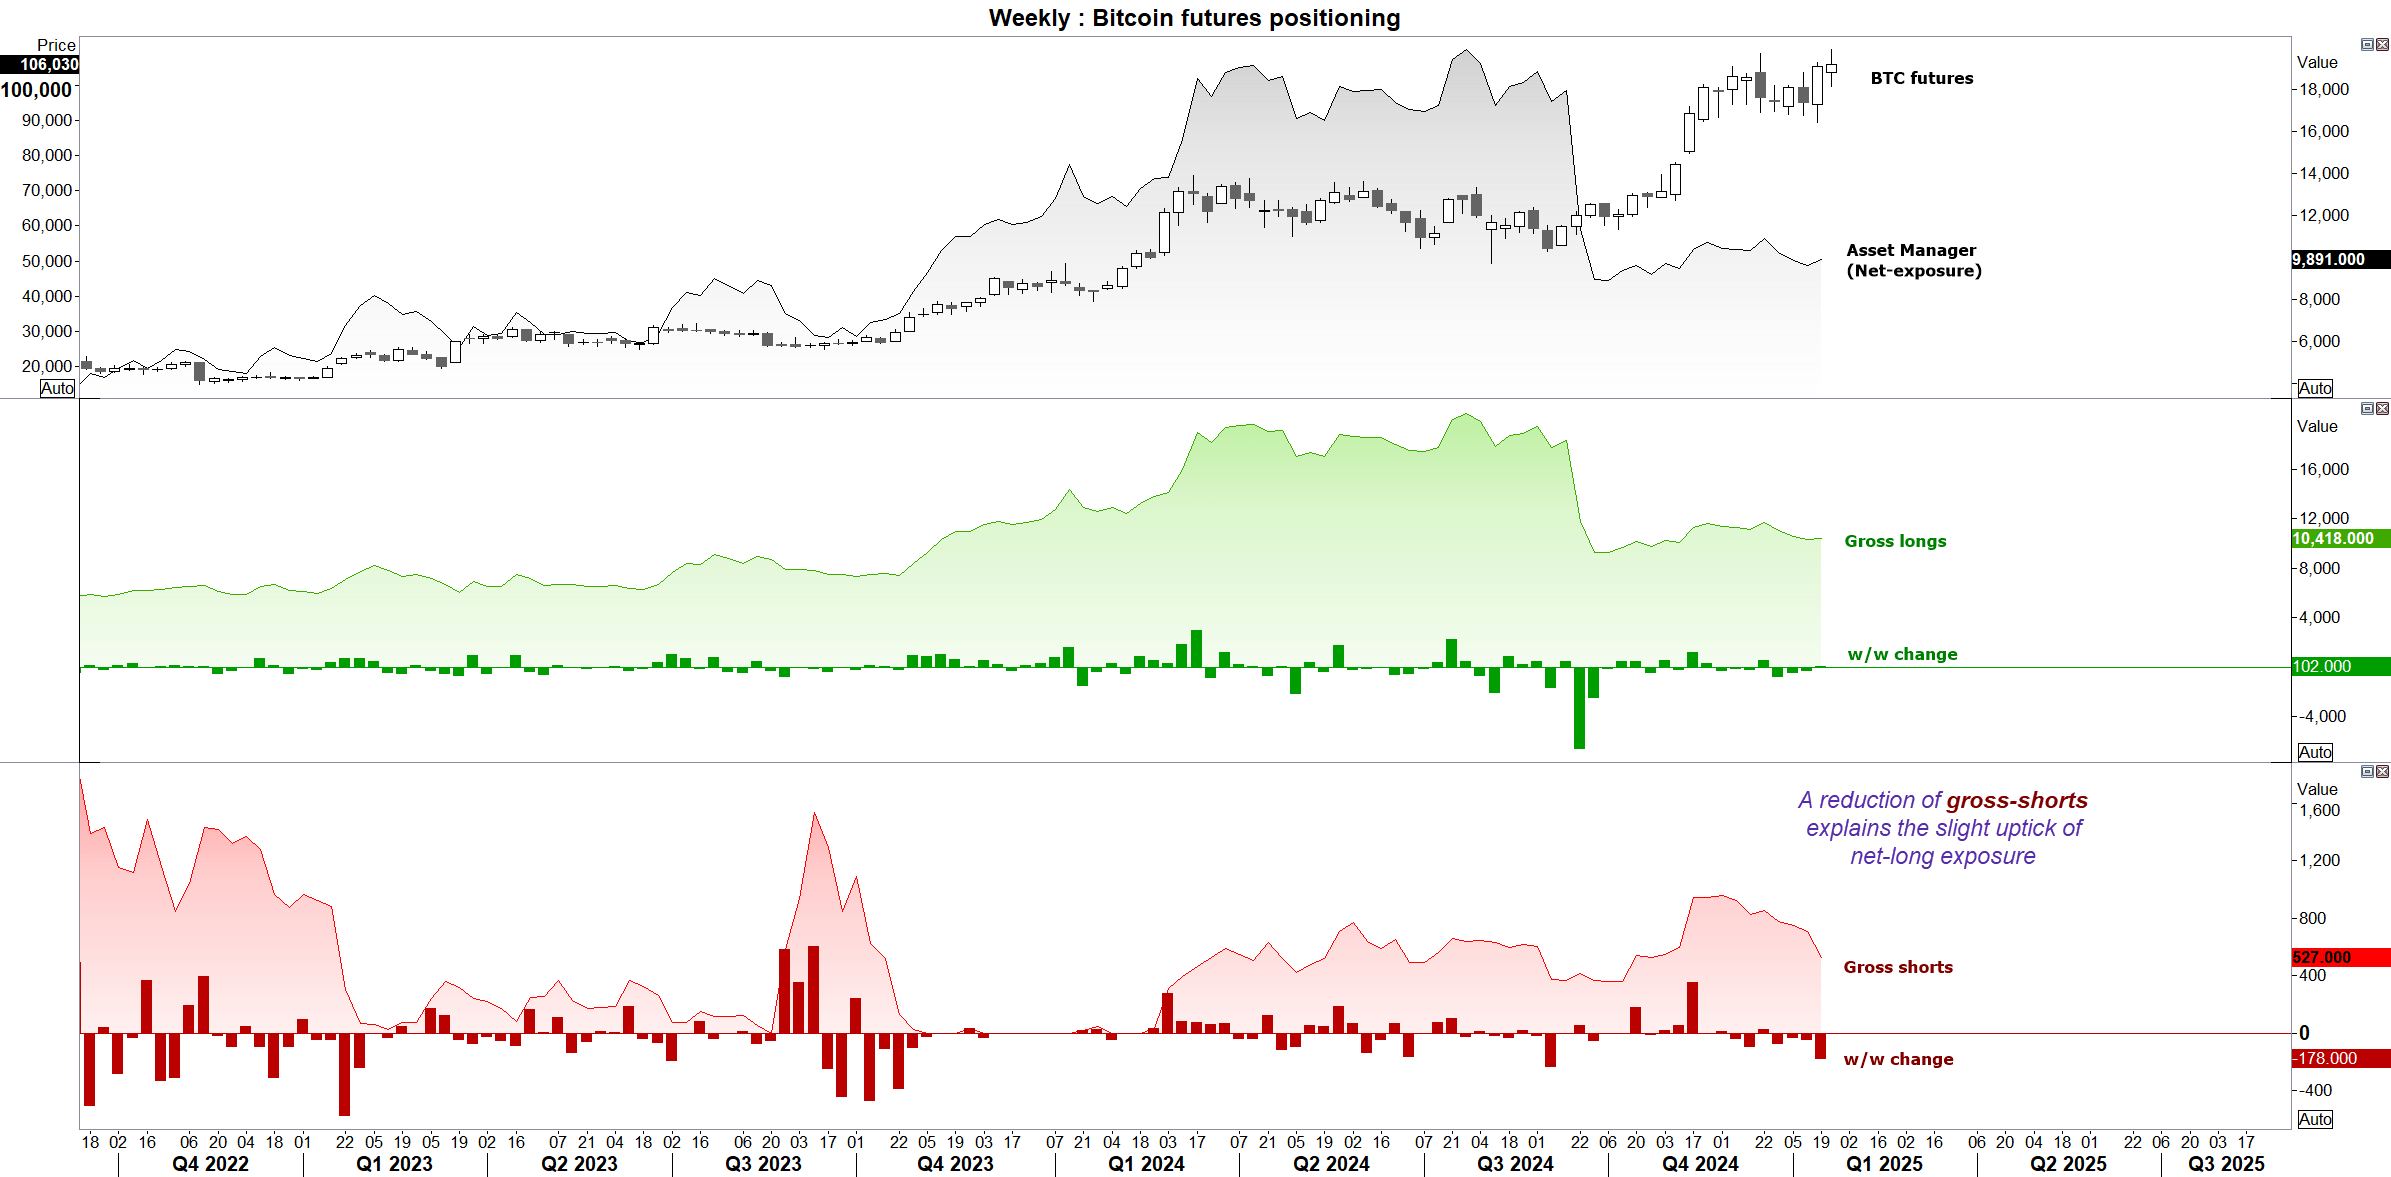
Bitcoin futures market positioning – COT report
Asset managers increased their net-long exposure slightly last week, and bullish bets outweigh bearish ones by a ratio of ~20:1. Yet it was a reduction of gross shorts which explains the uptick of net bullish exposure, as opposed to an influx of bullish bets. Perhaps this is another reason for bulls to be wary of an imminent breakout.

Bitcoin futures (BTC) technical analysis
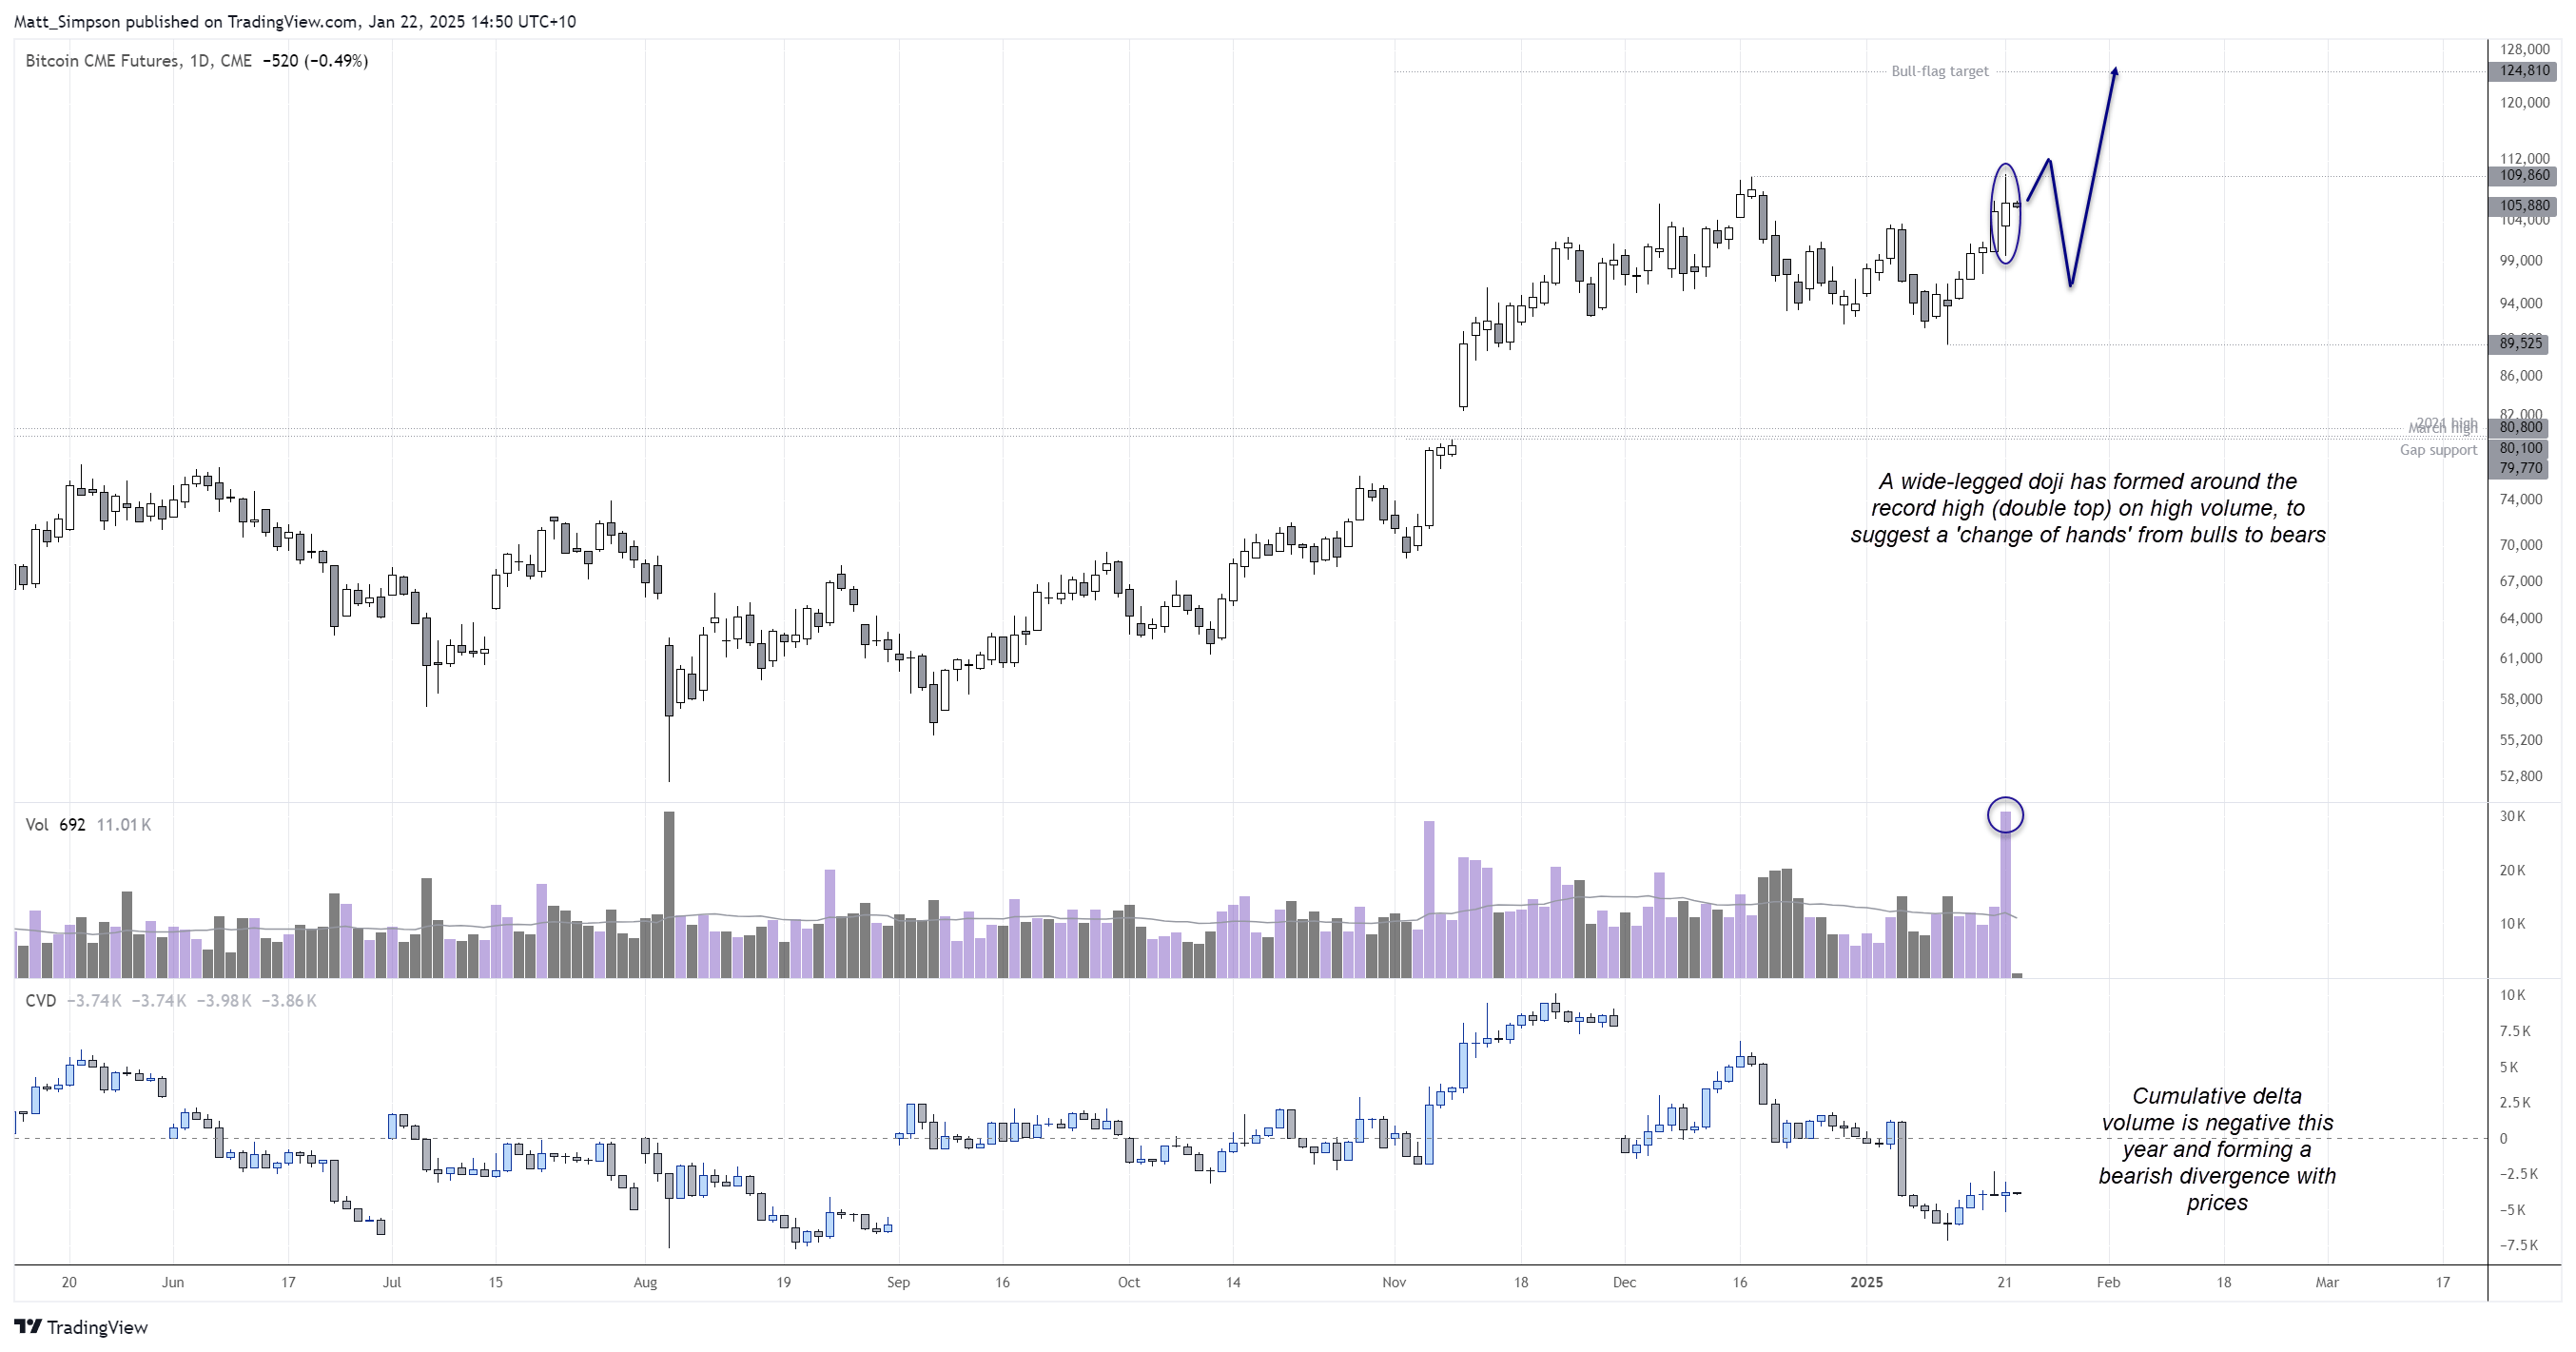
The daily chart shows a long-legged doji formed at the record high, and as it was seen on high volume it suggests a ‘change of hands’ from bulls to bears at what could be a double top. Also note that cumulative delta volume (CVM) has been trending lower this year, meaning there have been more bids than offers and it is forming a bearish divergence.
Given price action clues, volume analysis and market positioning, I suspect the initial breakout could be a false move. And that will place me on guard for a retracement within last week’s bullish engulfing candle for a swing low ahead of the real breakout and rally I anticipate to 125k.

-- Written by Matt Simpson
Follow Matt on Twitter @cLeverEdge


