Australian Technical Forecast: AUD/USD Weekly Trade Levels
- Aussie plunges more than 8.7% off yearly high- marks second consecutive weekly decline
- AUD/USD threatens break of multi-year trend support at yearly low- Fed on tap
- Resistance 6433, 6511/27 (key), 6617- Support 6335,6283, 6200/10 (key)
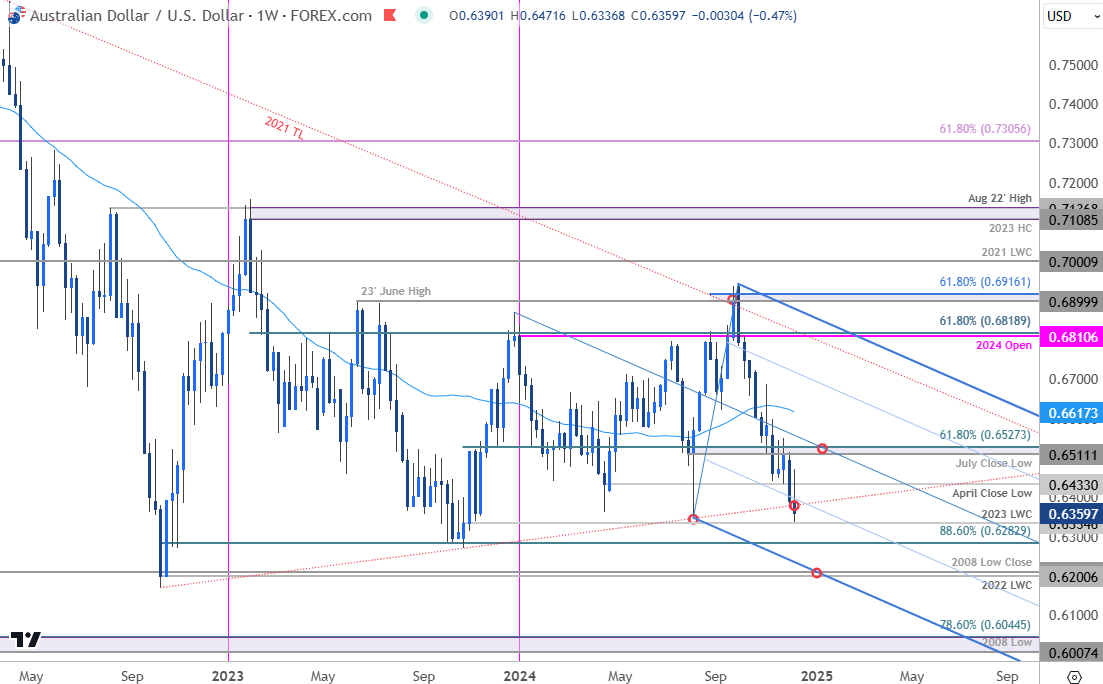
The Australian Dollar losses continued this week with AUD/USD marking a second weekly decline into fresh yearly lows. The bears are now threatening a break of multi-year trend support and keeps the focus on a reaction into the 2023 low-week close. Battle lines drawn on the AUD/USD weekly technical chart ahead of the Fed rate decision.
Review my latest Weekly Strategy Webinar for an in-depth breakdown of this Aussie setup and more. Join live on Monday’s at 8:30am EST.Australian Dollar Price Chart – AUD/USD Weekly

Chart Prepared by Michael Boutros, Sr. Technical Strategist; AUD/USD on TradingView
Technical Outlook: In last month’s Australian Dollar Technical Forecast we noted that the AUD/USD recovery was testing a major pivot zone and that, “From a trading standpoint, any rallies would need to be limited to 6632 IF price is heading lower on this stretch with a close below 6414 needed to fuel the next major leg of the decline.” Aussie briefly registered an intraday high at 6550 before reversing sharply lower with price now attempting to break multi-year slope support.
Initial weekly support rests with the 2023 low-week close (LWC) at 6335. A break / weekly close below this threshold would validate a breakout of the yearly opening-range and keep the focus on subsequent support objectives at the 88.6% retracement of the 2022 advance at 6283 and the 2022 LWC / 2008 low close at 6200/10- look for a larger reaction there IF reached.
Initial weekly resistance is eyed with the April close low at 6433 and is backed by the July close low / 61.8% retracement of the October 2023 advance at 6511/27. Note that the median-line of a proposed descending pitchfork converges on this threshold and a breach / close above would be needed to suggest a more significant low is in place / a larger recovery is underway. Subsequent resistance seen with the 52-week moving average, currently near ~6617.
Bottom line: AUD/USD is threatening a break of multi-year support, and the focus is on a pivot into the yearly lows. From a trading standpoint, rallies should be limited to 6433 IF price is heading lower on this stretch with a close below 6335 needed to fuel the next leg of the decline.
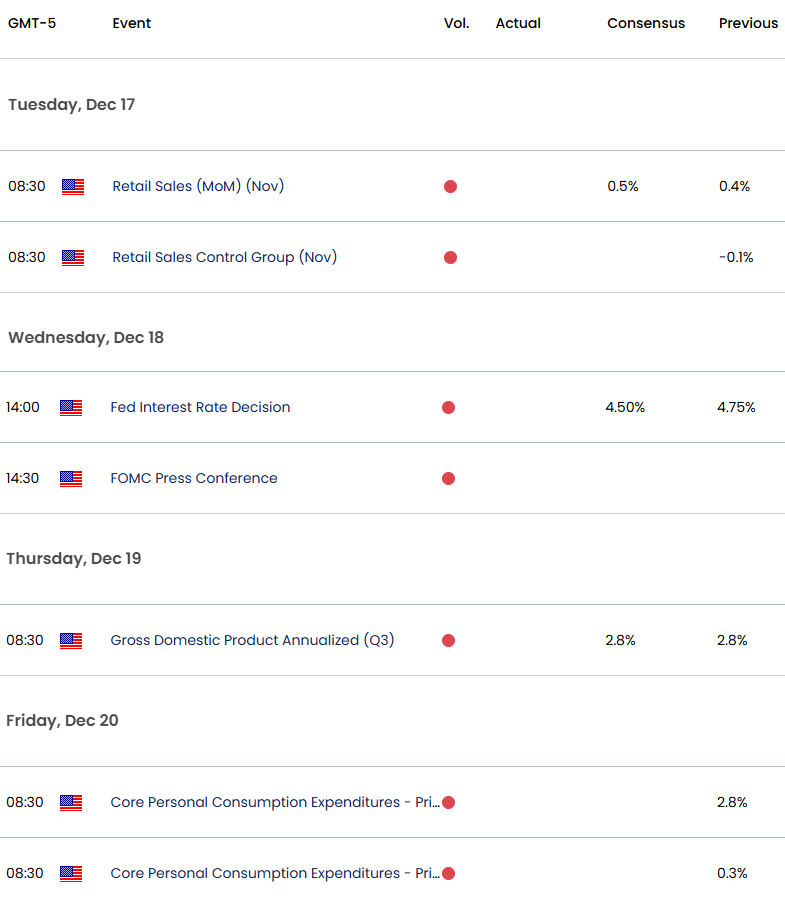
Keep in mind we get the release of the Federal Reserve interest rate decision on Wednesday with key US inflation data on tap Friday. Stay nimble into the releases and watch the weekly closes here for guidance. Review my latest Australian Dollar Short-term Outlook for a closer look at the near-term AUD/USD technical trade levels.
Australia / US Economic Calendar

Economic Calendar - latest economic developments and upcoming event risk.
Active Weekly Technical Charts
- Swiss Franc (USD/CHF)
- US Dollar Index (DXY)
- Euro (EUR/USD)
- Gold (XAU/USD)
- Japanese Yen (USD/JPY)
- Crude Oil (WTI)
- Canadian Dollar (USD/CAD)
- British Pound (GBP/USD)
--- Written by Michael Boutros, Sr Technical Strategist with FOREX.com
Follow Michael on X @MBForex


