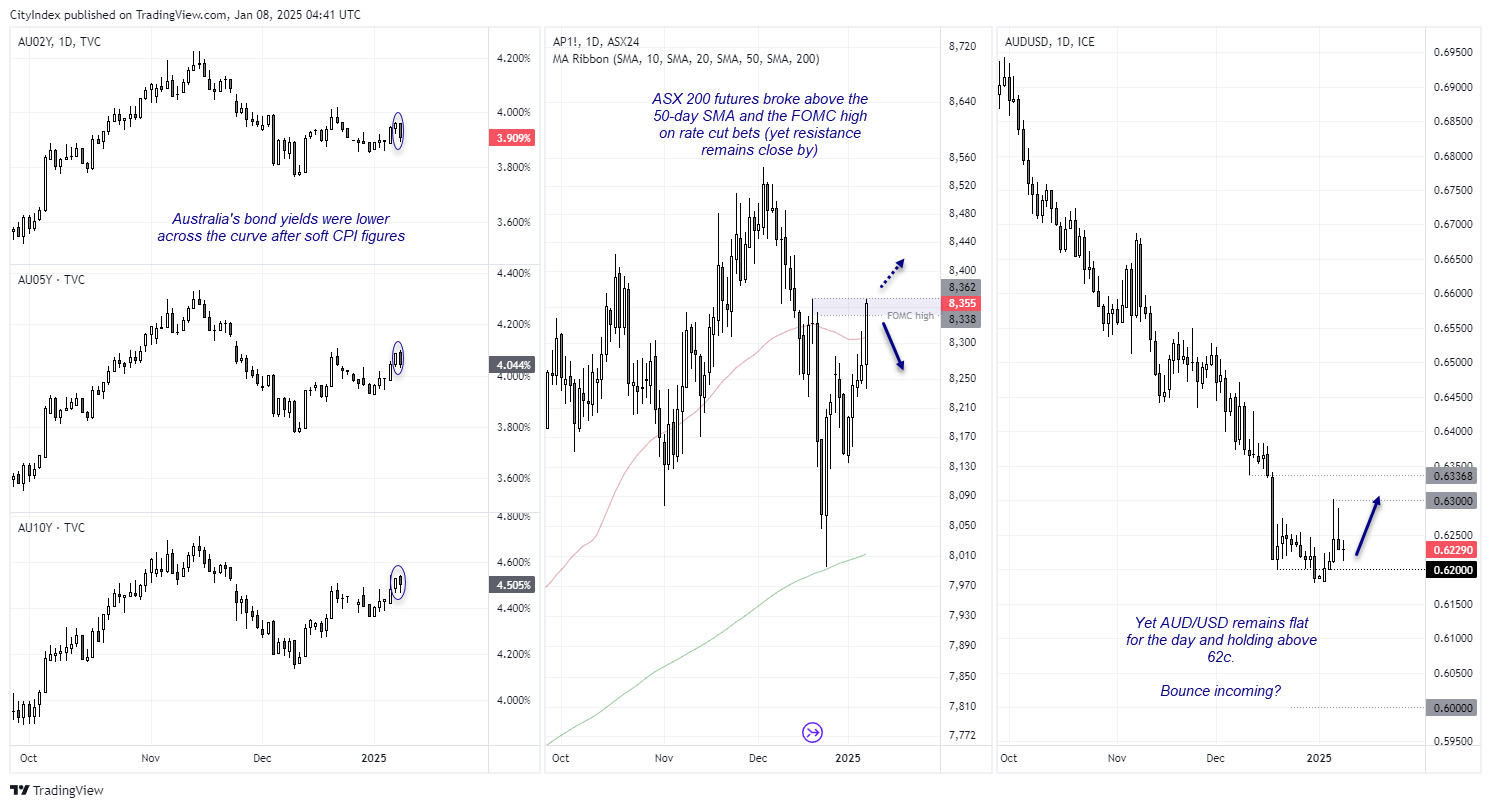
Today’s inflation report for Australia was more music to dovish ears, with annual trimmed mean falling to 3.2% y/y from 3.5% previously. The key inflation metric has now fallen five months over the past six, which places it just 0.2 percentage points above the RBA’s 2-3% inflation target.
Odds of a February cut are now over 80%, up from 55% when the RBA released dovish minutes before Christmas.

Personally, I believe odds of a February cut remain too high given the fall in unemployment and that fact that we’re yet to find out how inflationary the Trump administration could really be. Besides, the RBA will wait for the quarterly inflation figures released January 29, before deciding whether to cut in February. A set of weaker employment figures may also be required to justify immediate action, given their slow and steady approach monetary policy through turbulent times.
And that could help explain why AUD/USD is flat for the day, even if bond yields were lower and the ASX rallied as it rejoiced the soft CPI print.

- Australian bond yields were lower across the curve with the 1-3 year yields dropping ~6 basis points during their worst day in four weeks.
- The ASX 200 also broke above the FOMC high and on track for its fifth bullish day in a row. While this brings my earlier call for a swing high into question, it’s not out for the count yet with resistance nearby
- AUD/USD is effectively flat for the day, likely due to the sideways trade on USD/CNH and the US dollar index
- I continue to suspect a bounce for AUD/USD is due, given its reluctance to weaken on renewed calls for RBA cuts
EUR/AUD technical analysis
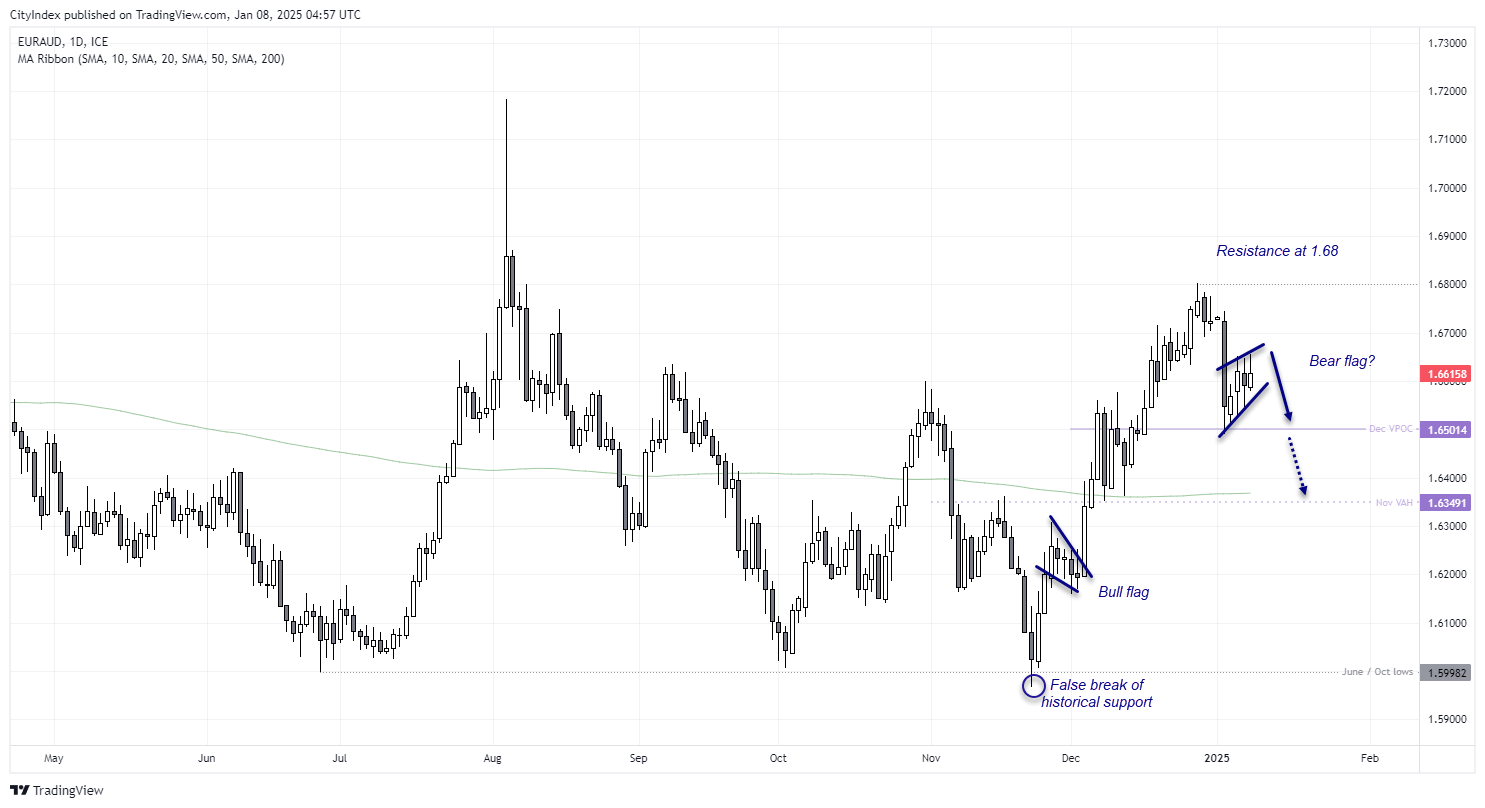
If AUD/USD can bounce from current levels, it could also force EUR/USD into its next leg lower. It saw a decent rally following a false break of its June and October lows, yet it has struggled since tapping the 1.68 handle in late December. A clear bearish-range expansion day arrived on January 2 and its feeble effort to since recover those losses looks like a bearish flag ion the making. In fact, it looks like the inverse of what we saw on December 4: A momentum shift following followed by a small multi-day pullback. If history is to repeat (but flipped), then EUR/AUD could appeal to bears over the near term.
Bears could target the lows near 1.6500 near the December VPOC (volume point of control) and fade into rallies today’s high. A break beneath 1.6500 brings the 200-day SMA into focus near November’s VAH value-area high.

View the full economic calendar
-- Written by Matt Simpson
Follow Matt on Twitter @cLeverEdge


