ECB Cuts Rates While Revising Forecasts
The European Central Bank (ECB) met expectations on Thursday by lowering key interest rates by 0.25 percentage points. The deposit rate now stands at 3%, as the ECB adjusted its economic outlook for the eurozone. Inflation is projected to reach 2.1% in 2025, approaching the ECB's target, while growth forecasts suggest a gradual recovery.
The eurozone economy is expected to grow by 0.7% in 2024, followed by modest gains of 1.1% and 1.4% in subsequent years. Positive real wage growth and further rate cuts are anticipated to drive private consumption and economic recovery. Markets are currently pricing in five additional rate cuts over the next four quarters, but analysts suggest this outlook may be overly optimistic, with a deposit rate closer to 2% more likely by the end of 2025.
Asian Stocks Decline as Dollar Strength Dampens Sentiment
Asian stocks fell on Friday as the strength of the U.S. dollar dampened risk appetite and spurred concerns across emerging markets. This market movement was underpinned by a sharp rise in longer-dated U.S. Treasury yields, which recorded their steepest weekly climb in over a year. The surge in yields could signal weakening expectations for significant Federal Reserve rate cuts in 2025.
China's markets faced pressure despite pledges from Beijing to support debt and boost consumption. Investor confidence was further shaken by concerns over potential trade tensions should Donald Trump return to the U.S. presidency. The broader impact of a stronger dollar hit emerging market currencies, compelling central banks in Indonesia and India to intervene to stabilize their respective markets. In Europe, indices opened higher, with the DAX continuing its all time high hunt.
Dollar Strength Buoys Amid Global Rate Cuts
Rate cuts from central banks in Switzerland, Canada, and the European Central Bank (ECB) have widened interest rate differentials in favor of the dollar, propelling it higher against major currencies like the Japanese yen, Swiss franc, and euro. This reinforces the dollar's safe-haven appeal within uncertainty in the global markets.
Oil and Gold Steady Amid Broader Volatility
In the commodities space, oil prices held steady and recorded weekly gains as traders weighed supply constraints against demand risks. Gold rose by 2.1% this week, supported by global monetary easing measures, which boosted its attractiveness as a hedge against inflation and currency volatility.
Corporate Sector Highlights
Shares of Adobe fell nearly 10% in premarket trading after the company’s disappointing revenue forecast raised concerns about delayed returns from its AI investments. Meanwhile, Microsoft shareholders rejected a proposal to add Bitcoin to the company’s balance sheet, showcasing a cautious stance on cryptocurrency adoption.
Oracle Corporation also faced challenges, with its stock dropping 6.7% following weaker-than-expected third-quarter earnings. Increased competition in the cloud computing sector, Oracle’s primary revenue driver, weighed on investor sentiment. Despite being up 70% year-to-date, Oracle’s growth potential appears constrained in the near term.
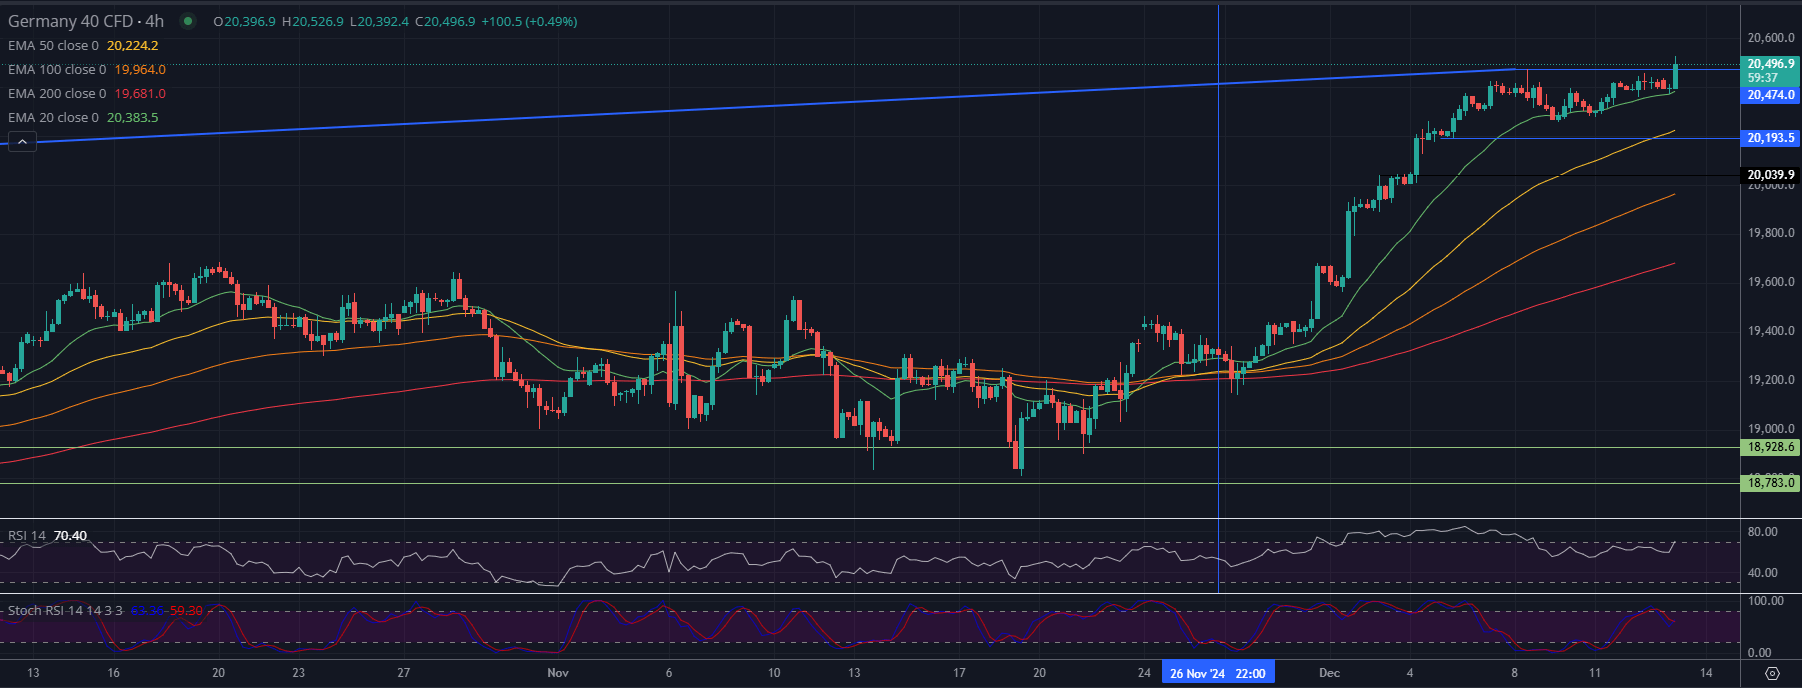
DAX (Germany 40) 4H - Technical analysis

Moving Averages
- 20 EMA (short-term): The price is trading above this level, indicating strong short-term momentum.
- 50 EMA (medium-term): This moving average has acted as a dynamic support level during retracements, confirming bullish medium-term momentum.
- 100 EMA & 200 EMA (long-term): The index remains above both these moving averages, indicating strong long-term strength and investor confidence.
Key Support and Resistance Levels
- Support Levels:
- 20,193.5: The price recently bounced from this level, suggesting it as short-term support.
- 19,964: Near the 100 EMA, this is the next significant support level if the price retraces further.
- 18,928.6 & 18,783: Longer-term support levels, though unlikely to be tested unless there is significant downward momentum.
- Resistance Levels:
- 20,526.9: The current high on the chart is a critical short-term resistance level.
- 21,000: A potential psychological resistance level if the price continues its bullish trajectory.
Indicators
- RSI (Relative Strength Index):
- Current Level (~70.4): RSI is in the overbought territory, suggesting caution as the price may see some consolidation or minor pullbacks.
- Stochastic RSI:
- Crossing Downwards: The Stochastic RSI is showing signs of a potential correction as it is exiting overbought levels. This could indicate a short-term cooling-off period.
Chart Patterns
- Breakout Zone: The index has recently broken above a critical horizontal resistance level near 20,482.4, which has now turned into support and has now made a new all time high.
- Bullish Continuation Pattern: The steady rise indicates a possible continuation of the bullish trend, provided the index sustains above key support levels.
Outlook
- Bullish Scenario:
- Sustaining above 20,350 (EMA 20) could lead to a retest and potential breakout above the 20,526.9 resistance. A successful breakout could see the index targeting higher levels, including 21,000.
- Bearish Scenario:
- A break below 20,193.5 might lead to a correction towards the 19,964 level (near the 100 EMA). Further weakness could see the price testing 19,681 (200 EMA).


