FY 2025 Crude Oil Outlook
Crude oil prices in 2025 are set to be influenced by a mix of competing forces: China’s economic policies, Trump’s energy agenda, OPEC strategies, geopolitical conflicts, and the global shift to clean energy. The market remains range-bound, with uncertainty delaying a decisive breakout. Will 2025 be the year a clear direction emerges?
Key Events:
- OPEC and IEA Divergent Forecasts
- China’s Monetary Policies and Demand Potential
- Geopolitical reformations and risk premiums
- Trump’s Drill baby Drill Agenda
- Clean Energy Transitions
- Technical Analysis: 3-Month, 3-Week, and 3-Day Time Frames
OPEC and IEA Forecasts
OPEC issued its fifth consecutive downward revision in December for 2024 oil demand forecasts, accompanied by another cut for 2025, citing economic growth risks in key markets like China. This marks the largest adjustment since June, following the group’s decision to extend output cuts. The 2024 demand estimate was reduced from 1.82 million barrels per day (bpd) to 1.61 million bpd, while the 2025 forecast dropped from 1.54 million bpd to 1.45 million bpd. Despite these cuts, the global oil market is projected to return to a surplus in 2025, driven by increased production from non-OPEC members.
In contrast, the IEA predicts accelerated demand growth, with oil consumption rising from 840,000 bpd in 2024 to 1.1 million bpd in 2025, reaching a total of 103.9 million bpd. This increase is primarily attributed to petrochemical feedstocks, while transport fuel demand continues to lag due to technological advancements and changing consumer behavior.
These contrasting forecasts from OPEC and the IEA underscore the uncertainty surrounding oil prices, keeping the market in a range-bound consolidation phase. The longer this persists, the sharper and more decisive the eventual breakout—bullish or bearish—is expected to be.
China’s Monetary Policy and Demand
China is set to implement a “moderately loose” monetary policy in 2025, marking its first such move in 14 years. The last instance of this approach occurred during the 2008–2009 financial crisis, when China stimulated its economy through interest rate cuts, reserve requirement reductions, and increased fiscal spending. These measures spurred rapid credit expansion, economic growth, and inflation but were scaled back in 2011 to mitigate bubble risks.
While the specifics of China’s 2025 policy remain unclear, a similarly aggressive approach is anticipated as a response to potential trade conflicts under Trump’s administration. If successful, this stimulus could significantly boost oil demand and shift forecasts to the upside. However, failure to achieve the desired economic impact—coupled with 2025’s oversupply risks from non-OPEC producers—could add notable bearish pressures.
Trump’s “Drill Baby Drill” Agenda
Risks of oil overproduction are expected to dominate headlines in 2025, driven by Trump’s "Drill Baby Drill" agenda and Treasury Secretary Bessant’s 3-3-3 plan. The plan aims to increase oil output by 3 million barrels, achieve 3% GDP growth, and reduce the budget deficit by 3%. This oversupply strategy challenges OPEC+ countries, which had planned to unwind voluntary supply cuts initiated in 2022. To stabilize the market, OPEC+ extended these cuts through April 2025, though persistent downward revisions in demand forecasts—compounded by China’s economic contraction—highlight ongoing challenges.
Clean Energy Transitions
According to the IEA’s latest report, the global market for clean technologies—including solar PV, wind turbines, electric vehicles, batteries, electrolysers, and heat pumps—is projected to triple to over $2 trillion by 2030. This surge in clean energy adoption poses a significant challenge to oil demand forecasts, contributing to bearish sentiment. However, critics highlight the environmental limitations and inefficiencies of renewables, emphasizing the irreplaceable role of oil in the global energy mix. These contrasting views support the uncertainty in oil prices.
Technical Analysis: Quantifying Uncertainties
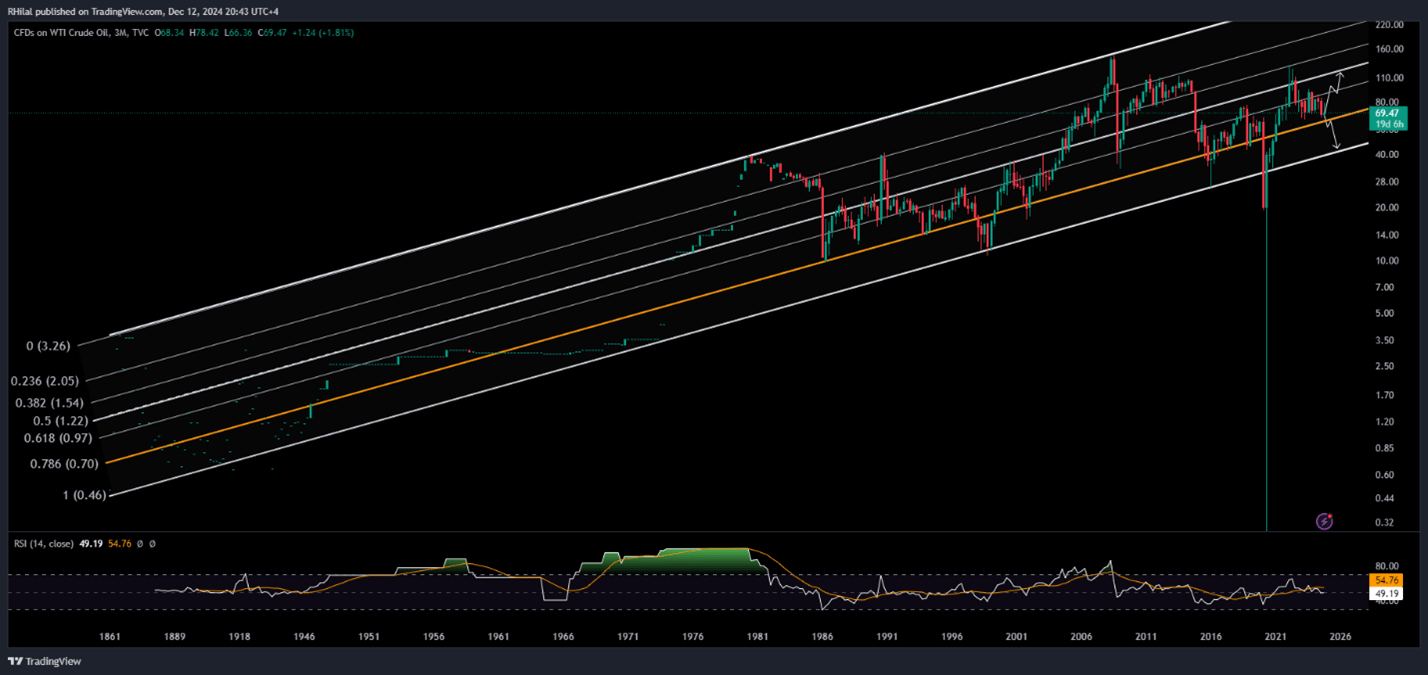
Crude Oil 3 Month Outlook – Log Scale

Source: Tradingview
Starting with crude oil's ascending channel, which extends from the historical lows of the 1800s, the respected Fibonacci channel ratios highlight oil's 2023–2024 range, constrained between the 0.786 Fibonacci support and the 0.618 resistance. In simpler terms, oil prices have maintained a range between the $64 support and the $90 resistance zones.
As 2024 concludes, prices are testing the 0.786 support level, with downside risks looming. A firm break below $64 could trigger a decline toward the channel's lower border, a zone between $49 and $43, which has only been breached during the COVID-19 collapse.
On the upside, the $90 resistance remains a critical level, followed by the 2023 high at $95. A breakout above these levels could pave the way toward the next resistance at $120, aligning with the 50% Fibonacci retracement and the mid-channel level. Such a surge would likely require a scenario of improved demand outlook and supply disruptions followed by geopolitical conflicts to materialize.
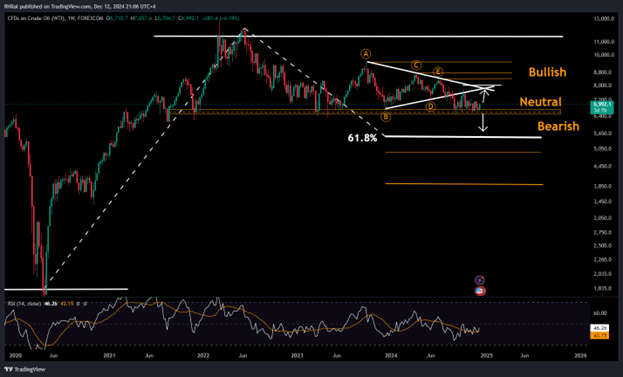
Crude Oil Weekly Outlook – Log Scale

Source: Tradingview
From a weekly perspective, the chart is structured as follows:
- Uptrend from 2020 to 2022
- Retracement between 2022 and 2023
- Consolidation/sideways pattern from 2023 to 2024
The current consolidation is holding above the 50% Fibonacci retracement of the 2020–2022 uptrend. However, bearish risks are increasing following a downside breakout from the yearlong triangle pattern. A minor consolidation has also emerged below the triangle’s border, resembling a potential head and shoulders continuation pattern, with shoulders forming just above a 4-year support extending from the December 2021 lows.
To confirm further downside, a firm close below this key support is required, which could accelerate the retracement toward the 0.618 Fibonacci level at $55, with additional risks extending to $49.
On the upside, if the 4-year support holds, it may signal the end of the retracement, paving the way for a resumption of the primary uptrend. This could see crude oil prices retest the 2023 highs (95) and potentially the 2022 peaks (120).
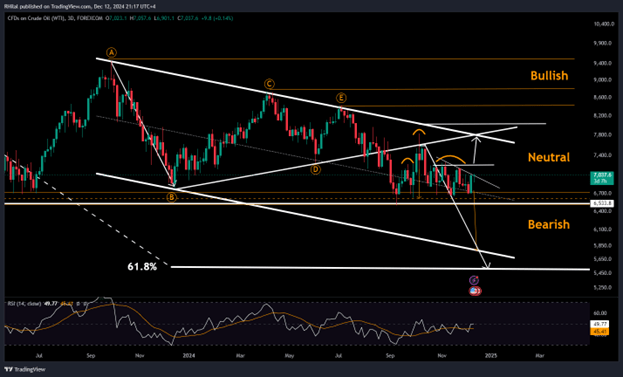
Crude Oil 3 Day Outlook – Log Scale

Source: Tradingview
Dropping to the 3-Day timeframe, crude oil remains within a down trending parallel channel extending from the upper border of the previous triangle pattern. This aligns with the triangle breakout target and a potential head and shoulders continuation pattern, which is still forming below the triangle’s boundaries. The Relative Strength Index (RSI) hovers below the 50-neutral zone, signaling the potential for another reversal or a bullish breakout.
While the broader trend leans bearish—in line with the sentiment for 2025—a decisive break below the 4-year support zone is required to confirm the next leg down. A firm break below $64 could trigger declines toward $60 (psychological support), $58 (lower channel border), and $55 (0.618 Fibonacci retracement of the 2020–2022 uptrend). Further downside risks could extend to the bottom border of the historical channel, ranging between $49 and $43.
On the upside, short-term resistance lies between $72 and $72.70, followed by the triangle thrust point near $78. A breakout above these levels could signal a return to bullish momentum, targeting the $80s zone with resistance levels at $84, $88, and $95, and potentially paving the way for a rally back toward 2022 highs above $100 per barrel.
Oil prices remain dominated by uncertainty, caught between bullish and bearish forecasts. The ongoing consolidation leaves prices range-bound, but the longer this phase persists, the steeper and more decisive the eventual breakout—in either direction—may be.
-- Written by Razan Hilal, CMT, Market Analyst
Follow Razan on X: @RH_Waves