Last week, during an interview with Joe Biden, the interviewer asked the President if he thought Russian President Vladimir Putin was a killer, to which the President responded, “Yes”. In addition, the US President said Putin would face repercussions for being a killer, as well as, for attempting to interfere in the US 2020 elections, in favor of Donald Trump. Putin responded by saying, “I wish him health.”
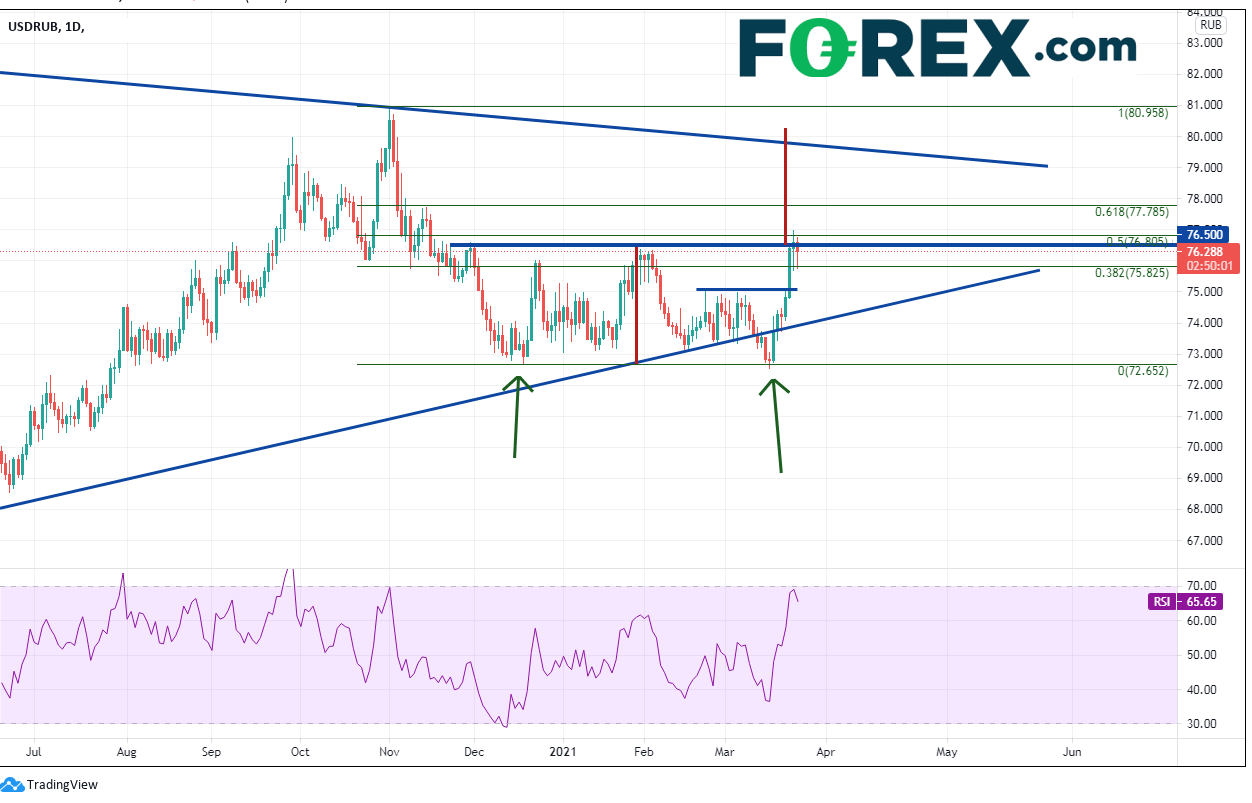
On March 16th, the day of the interview, the USD/RUB put in a double bottom near 72.65. Afterwards, the USD/RUB went bid and hasn’t looked back. Coincidentally, the Central Bank of the Republic of Turkey hiked interest rates 200 basis points that same day, from 17% to 19%. As a result of that rate hike, Turkish President Erdogan fired the head of the CBRT over the weekend which caused USD/TRY to gap higher on Monday. (See Currency Pair of the Week) The sharp USD/TRY move higher brought many emerging market currency pairs with it, including the USD/RUB.
Forex market hours: when is the best time of day to trade forex?
The USD/RUB had been in a long-term symmetrical triangle since the height of the pandemic on March 19th, 2020. The pair has been trading within the triangle for the last year until the pair briefly broke below on March 10th, which led to the double bottom on March 16th. As USD/RUB bid back up, it moved back into the symmetrical triangle to the 50% retracement of the November 2nd, 2020 highs to the March 16th double bottom lows, near 76.80. The target for a double bottom low is the height of the pattern added to the breakout point, or near 80.25. However, the pair must first get through resistance at the 61.8% Fibonacci retracement level from the same timeframe near 77.78, then the top, downward sloping trendline from the triangle near 79.80. Above there is the November 2nd highs near 80.95. Horizontal support below on the daily timeframe is near 75.00. Below that is the upward sloping trendline of the symmetrical triangle near 74.00 and then the double bottom lows of 72.65.

Source: Tradingview, FOREX.com
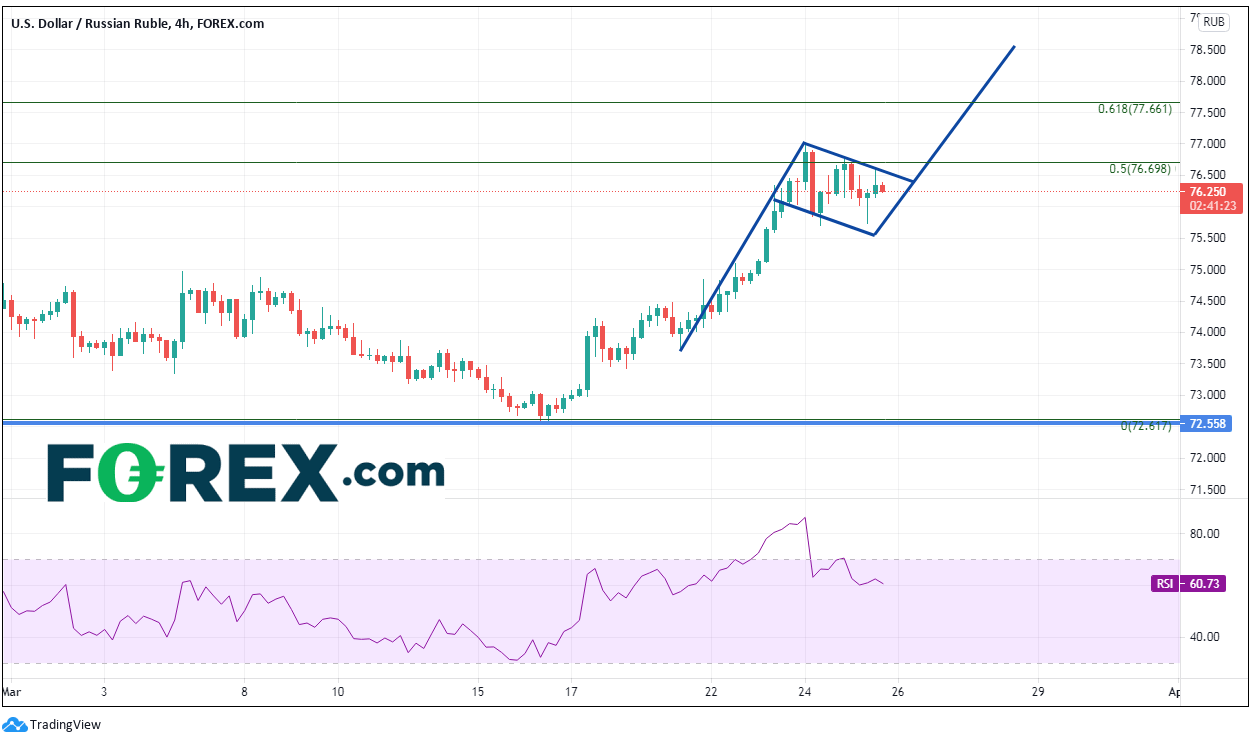
Note that on a 240-minute timeframe, the pair appears to be consolidating just below the aforementioned 50% level, as the RSI unwinds from overbought conditions. The target for a flag pattern is the length of the flagpole added to the breakout point, which is near 78.50.

Source: Tradingview, FOREX.com
If the continued “he said, she said” continues between the US and Russia, USD/RUB many continue to move higher. In addition, if the US Dollar vs emerging market currencies continue to move higher, it could bring USD/RUB with it. Add in the favorable technical picture, and the USD/RUB may be on its way to its technical targets!
Learn more about forex trading opportunities.


