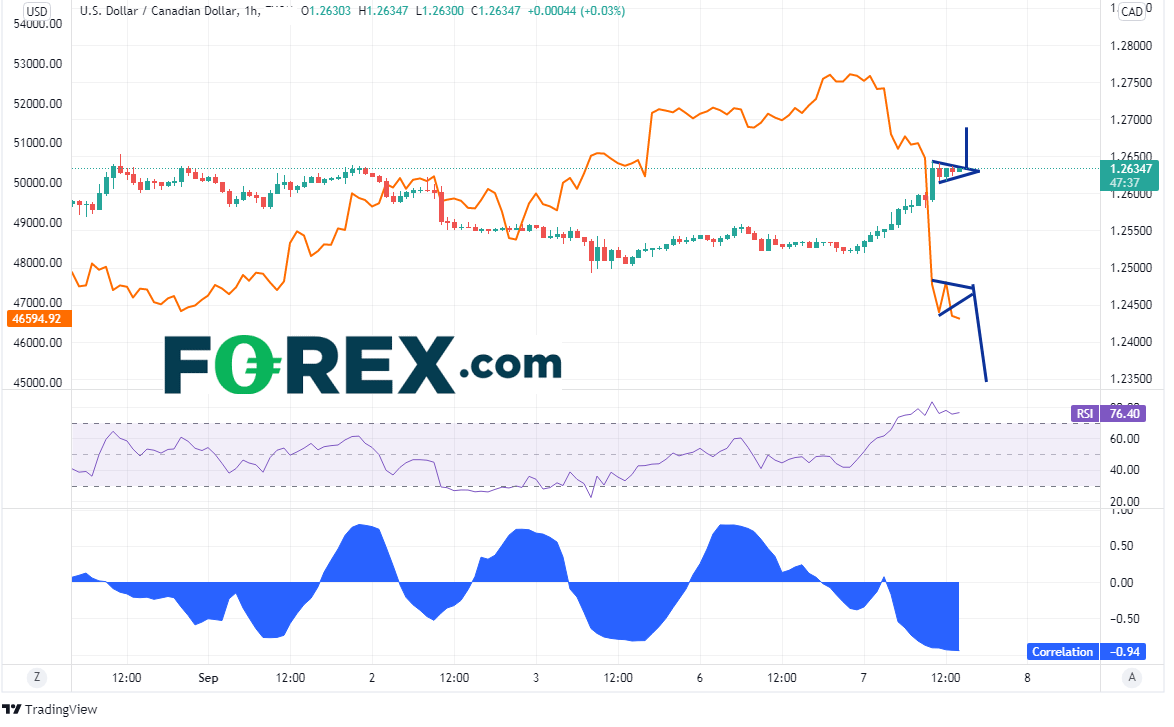
Check out the 1-hour price chart of USD/CAD below. Earlier this morning, USD/CAD made a quick move higher from 1.2590 to 1.2643, Price has been consolidating near the highs, creating a short-term pennant formation, while the RSI tries to unwind from overbought territory, currently at 76.40. The target for the pennant formation is near 1.2690.

Source: Tradingview, Stone X
Overlaid on the USD/CAD chart is the price action for Bitcoin (orange line). The 2 assets have been inversely related as of late. Therefore, as Bitcoin trades higher, USD/CAD has been trading lower, and vice-versa. Also notice at the bottom of the chart is the correlation coefficient between USD/CAD and Bitcoin. This measures the strength of the relationship in the direction of the move between the 2 assets. It is currently -0.94! For reference, a reading of -1.00 is a perfect negative correlation, meaning they will move in opposite directions 100% of the tme. -0.94 is pretty close!
CORRELATION MEASURES DIRECTION, NOT MAGNITUDE. One should not assume that if BTC has a monster move in one direction, that USD/CAD will have a monster move in the opposite direction, only that it should move in the opposite direction based on the 1-hour correlation.
The target for Bitcoin based on the pennant formation lower today is near 45,000. If the cryptocurrency completes the move to target, USD/CAD should be on its way higher. Currency traders can use this relationship between the 2 assets as another tool. If BTC is to continue moving lower, traders may consider a long in USD/CAD given the current correlation.
Note that this is only a 1-hour chart. The correlation is weaker on longer-term time frames. Also, as one can see from the volatility of the correlation coefficient, it changes over time. It is best to use this indicator when it is above +0.80 or below -0.80.
Learn more about forex trading opportunities.


