US Existing Home Sales rebounded in June, up +1.4% MoM vs +0.9% expected and -1.2% in May. This is in addition to the strong June US Housing Starts released Tuesday, which was +6.3% vs 0.8% expected and +2.1% in May. Next week, we’ll get US Pending home sales, which are currently expected to be -1% vs +8% in May. Will Pending Homes Sales continue the trend of better than expected housing data?
In addition to the Housing data next week, there is a FOMC meeting. The Fed’s current monetary policy is extremely accommodative, keeping interest rates near zero and purchasing $120 billion of US Government bonds per month. There makeup of the type of bonds that the Fed buys is $80 billion US Treasury bonds and $40 billion of Mortgage-Backed Securities. Last week, Fed Chairman Powell testified to Congress in his semi-annual report on the economy that he does not believe that the purchase of MBSs are contributing to a boom in the housing market. In addition, Powell said that “substantial further progress” towards full employment is still a ways off, thus he doesn’t intend on tapering bond purchases anytime soon. We’ll find out more at next week’s FOMC meeting!
Everything you need to know about the Federal Reserve
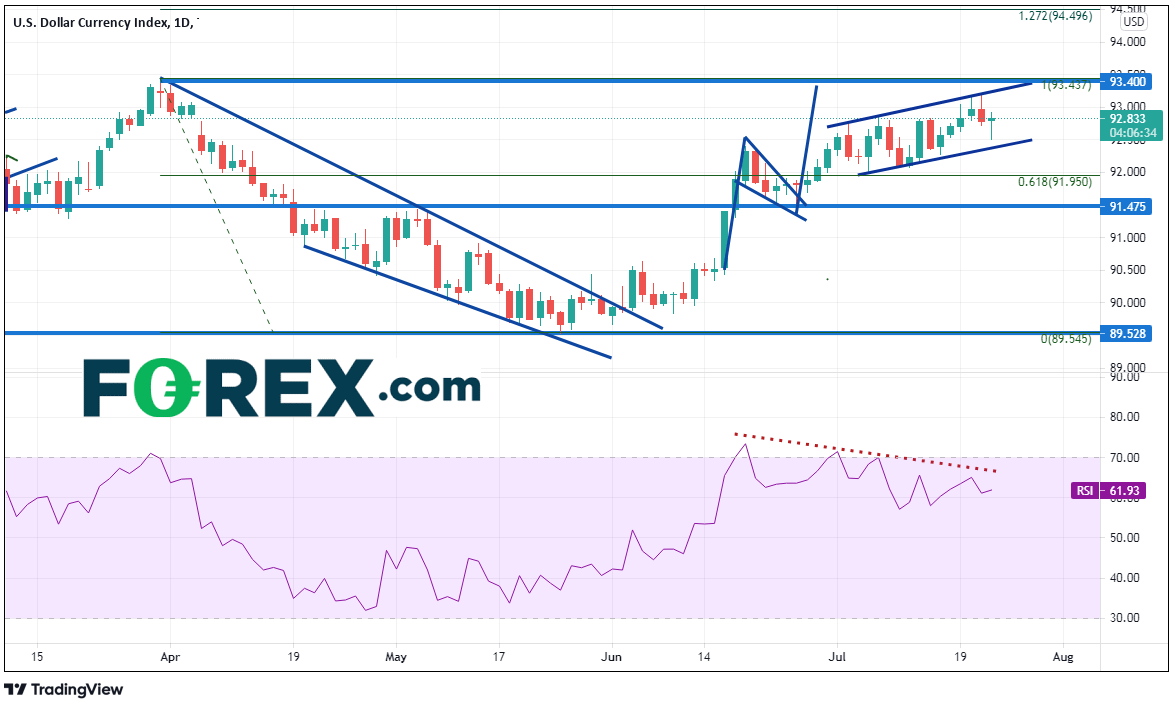
The US Dollar Index (DXY) appears to be channeling the data into higher prices. As homebuyers rush to market to purchase homes before the Fed begins tapering, the US Dollar is grinding higher in anticipation of near-term inflation. On the daily timeframe, the DXY began moving lower on March 31st from a high of 93.43 to a low of 89.53 on May 25th, forming a descending wedge. The target for a breakout of a descending wedge is a 100% retracement of the wedge. The DXY broke higher out of the wedge in early June and paused just above 61.8% Fibonacci retracement level from the March 31st highs to the May 25th lows, near 92.05, then pulled back forming a pennant pattern. The target of a pennant is the length of the pennant “pole” added to the breakout point, which is near the same target for the longer-term wedge, 93.43.

Source: Tradingview, FOREX.com
What is the US Dollar Index (DXY)?
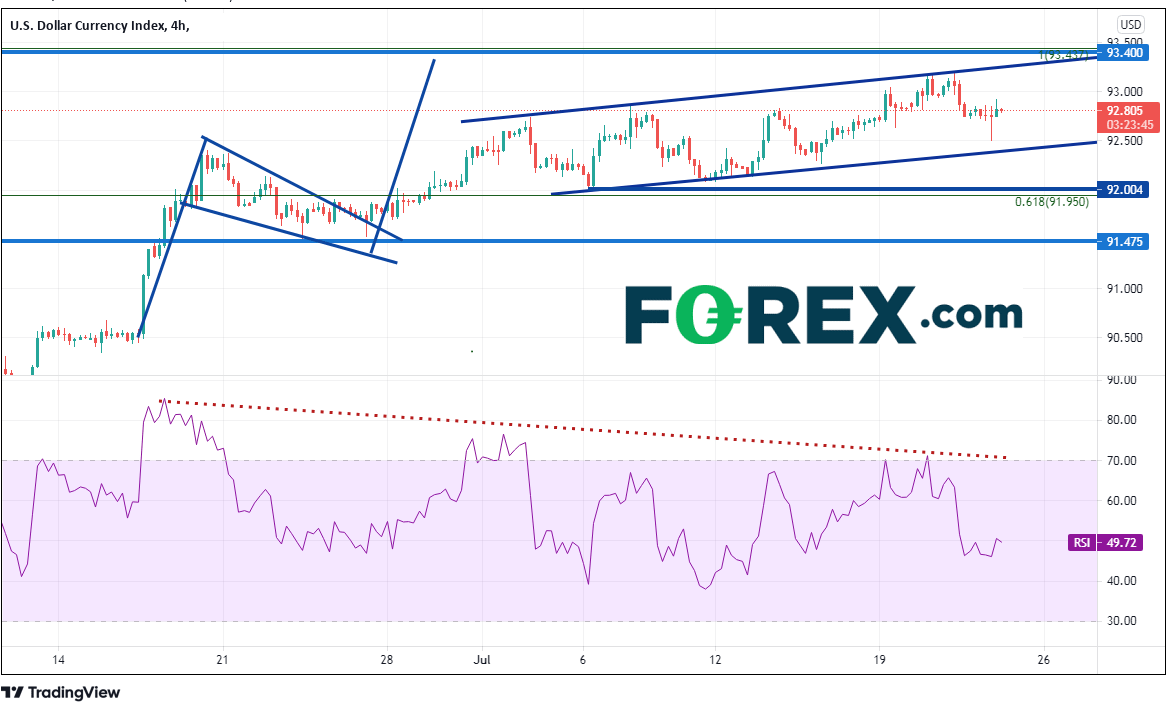
On a 240-minute timeframe, we can easily see that once the DXY broke out of its pennant formation, price began moving towards its target within a channel. Note, however, that the RSI has been diverging with price, an indication that the DXY may be ready for a pullback. Resistance is at the top trendline of the channel near 93.25, just ahead of the target and March 31st high of 93.43. Support is at the lows of the channel near 92.50, and then horizontal support from the July 6th lows near 92.00.

Source: Tradingview, FOREX.com
With the Fed apparently in no hurry to begin tapering MBSs any time soon, monetary policy will remain accommodative. And as long as monetary policy is accommodative, the housing market should remain buoyant. However, the DXY has already begun to price in the Fed’s tapering decision. Next week, if they indicate that they will delay announcing tapering passed the September meeting, DXY could move lower. However, if the committee causes Chairman Powell to change his tune and announce tapering sooner than later, the DXY will go bid! All eyes on housing data, FOMC, and the DXY next week!
Learn more about forex trading opportunities.


