There hasn’t been that much news to trade off today, yet the US dollar continues to trade higher. Republicans in the House of Representatives blocked a House resolution which would have called on Vice President Mike Pence to invoke the 25th amendment and remove President Trump from office. However, the markets are already looking past the 9 days Trump has left in the White House. Therefore, what is driving the US Dollar higher, and can it continue? In the Week Ahead, we discussed how rising yields were lifting the US Dollar. But the reason doesn’t really matter. Traders need to be considering whether the US Dollar still has room to move higher!
DXY
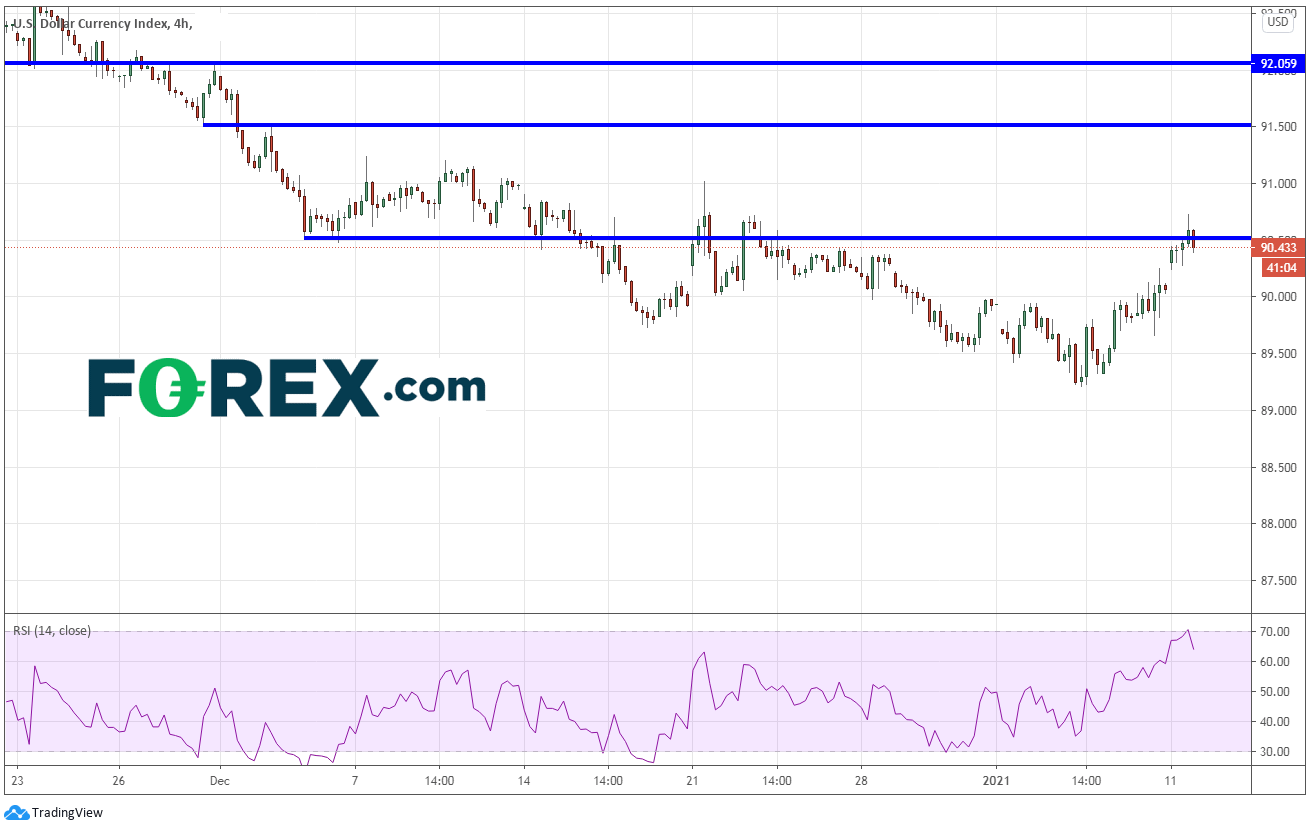
The US Dollar Index gapped open higher after the weekend and moved into resistance near the 90.50/60 area. The gap fill is an important first support area, which incidentally is near the psychological 90.00 area. If price can hold above there, the DXY can run to 91.50, and possibly even 92.00 Note the RSI hit 70 and turned lower. The index may just be biding its time while waiting for the RSI to move further into neutral territory.

Source: Tradingview, FOREX.com
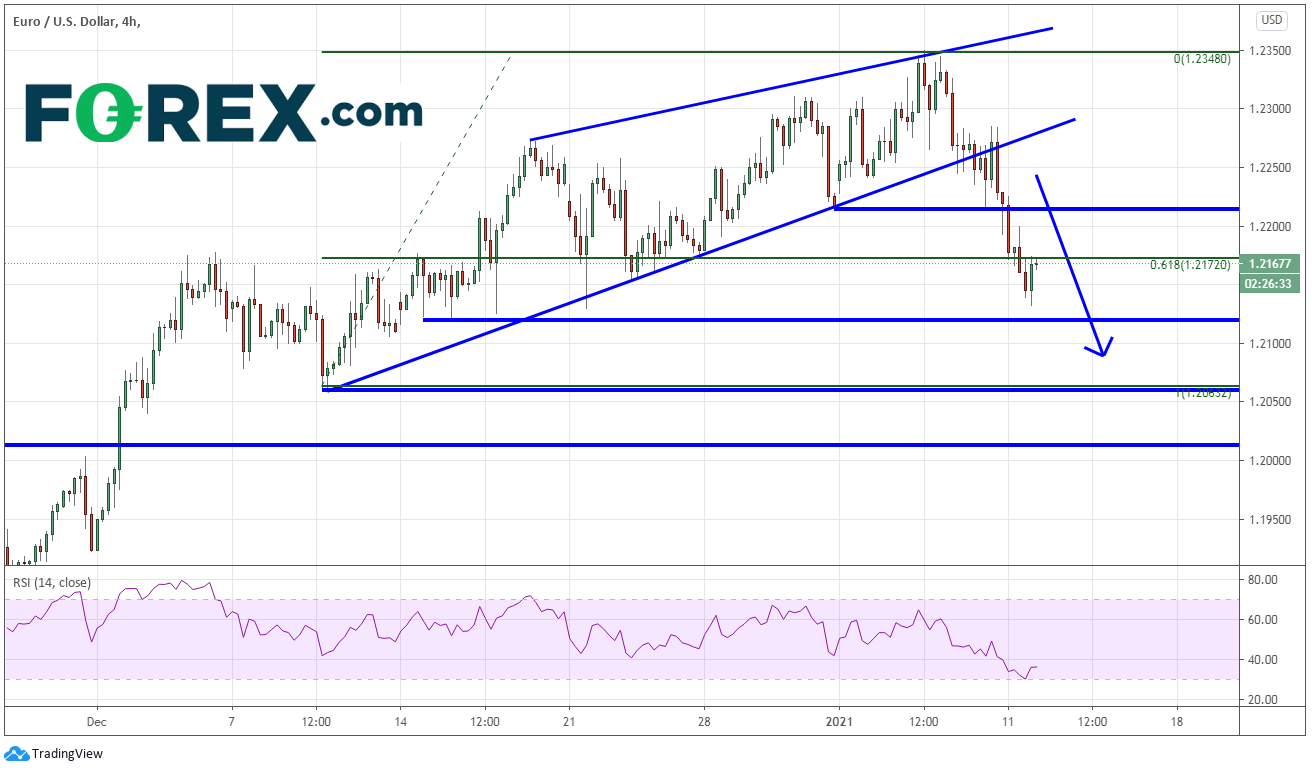
EUR/USD is moving opposite the DXY. The pair broke lower below an ascending channel on Friday and continues to move lower. The target for the breakdown of an ascending wedge is a full 100% retracement. EUR/USD has already retraced below the 61.8% Fibonacci level from the wedge lows to highs and is stalling just below it. The RSI hit the 30 level and bounced. The latest bar on the 240-minute timeframe is a bullish engulfing candlestick, so a bounce would not be out of the question. If EUR/USD could remain below 1.2200, the RSI will have time to unwind and the pair could move lower. 1.2125 is the next of support before retracing the entire wedge down to 1.2058, where buyers would be looking to step in. Above 1.2200, resistance is at 1.2213 and 1.2283. Watch for sellers in front of Wednesday’s highs of 1.2350.

Source: Tradingview, FOREX.com
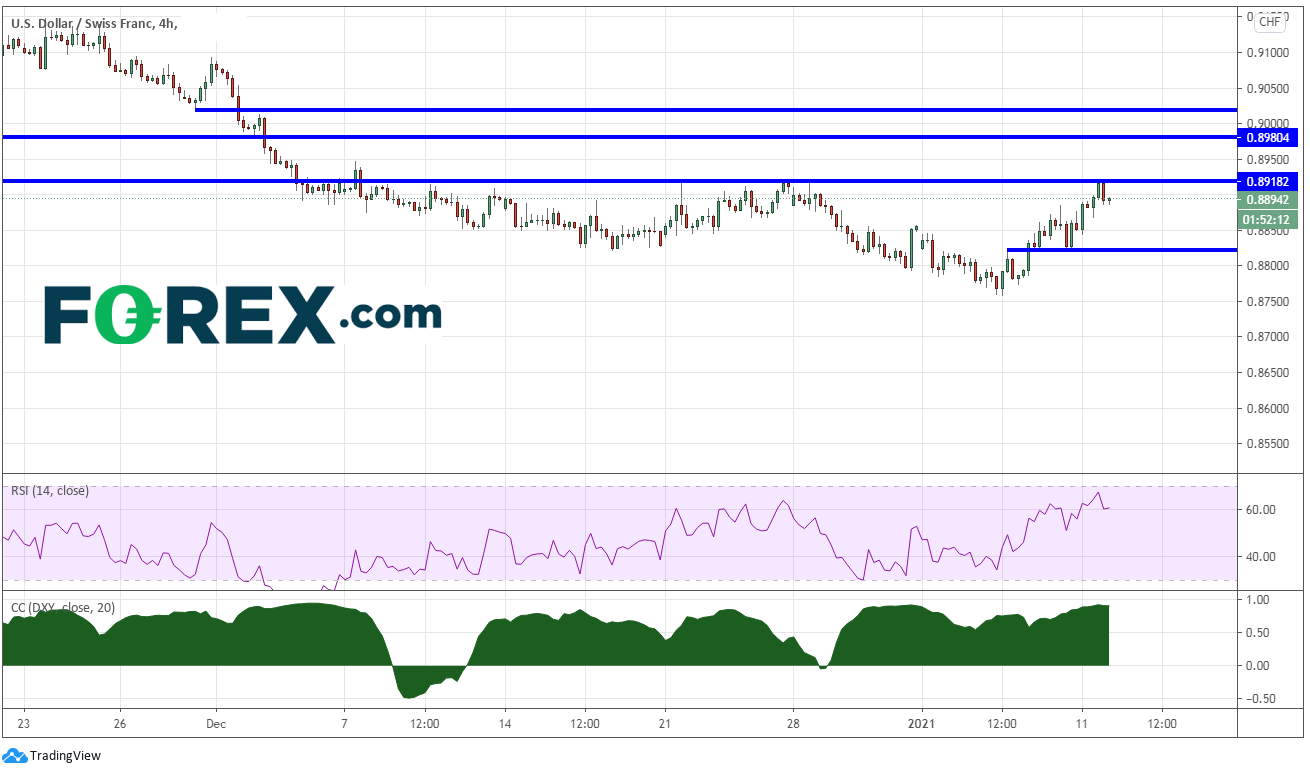
When traders don’t have access to the DXY, they often trade USD/CHF as a segregate. Notice the correlation coefficient at the bottom of the chart below is currently +.91. A correlation of +1.00 indicates a perfect positive correlation between the 2 assets. USD/CHF traded right up to resistance today at 0.8920. Price is pausing while the RSI pulls back from near 70.00. A move above in price would target horizontal resistance 0.8980 and then .9020. If the US Dollar moves lower, it could move to support near Friday’s lows at 0.8824.

Source: Tradingview, FOREX.com
For many US Dollar pairs, the trend in the medium term (240-minute timeframe) is higher. Pullbacks may be opportunities for the RSI to unwind further before resuming higher. Bulls will be looking to buy dips towards the gap in DXY. They may also be looking to sell Euros and Swiss if DXY does pullback!
Learn more about forex trading opportunities.