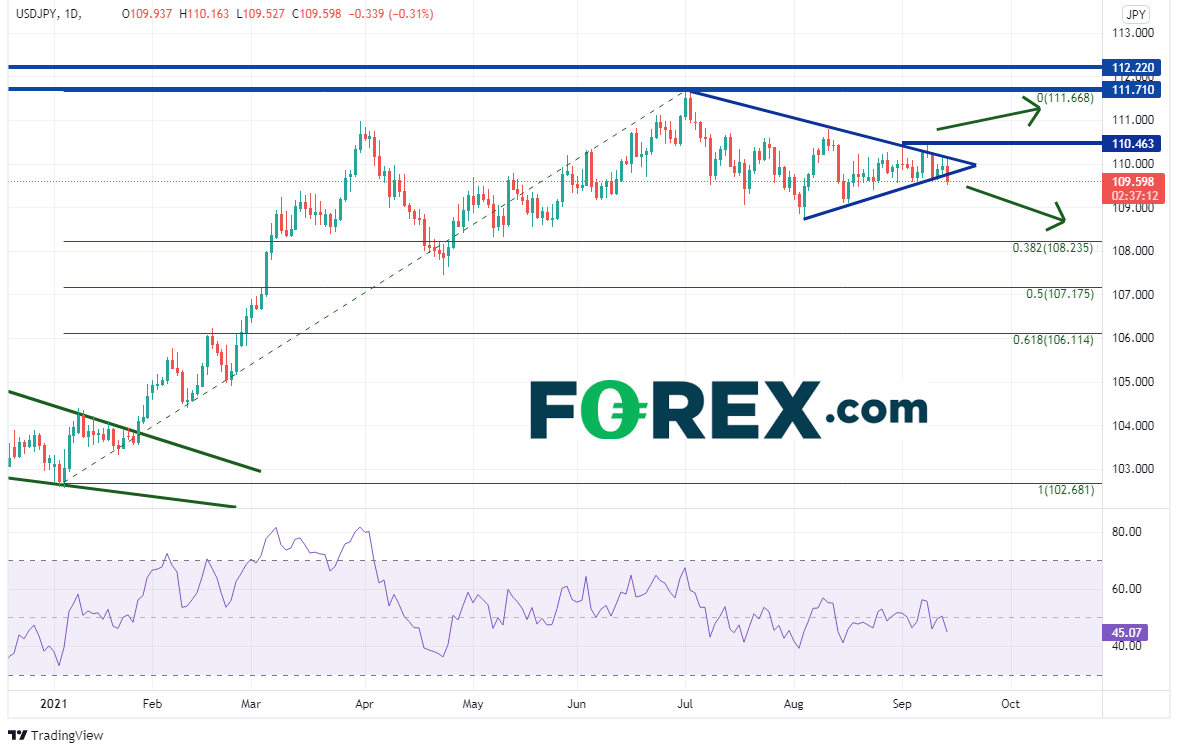
USD/JPY has not been a friend of Yen traders as of late. But is it finally ready for a move? On a daily timeframe, we can see that during the first half of 2021, USD/JPY moved one way: higher. The pair put in a low of 102.59 on January 6th and made a high on July 3rd at 111.65. However, since then, USD/JPY has been trading in a symmetrical triangle and consolidating, as price approaches the apex. On September 8th, the pair made a false breakout above the top of the triangle but was halted and send lower at horizontal resistance near 110.46. Today, USD/JPY appears to be making a move below the triangle. Could this be the move Yen traders have been waiting for enter a position in USD/JPY?

Source: Tradingview, Stone X
Trade USD/JPY now: Login or open a new account!
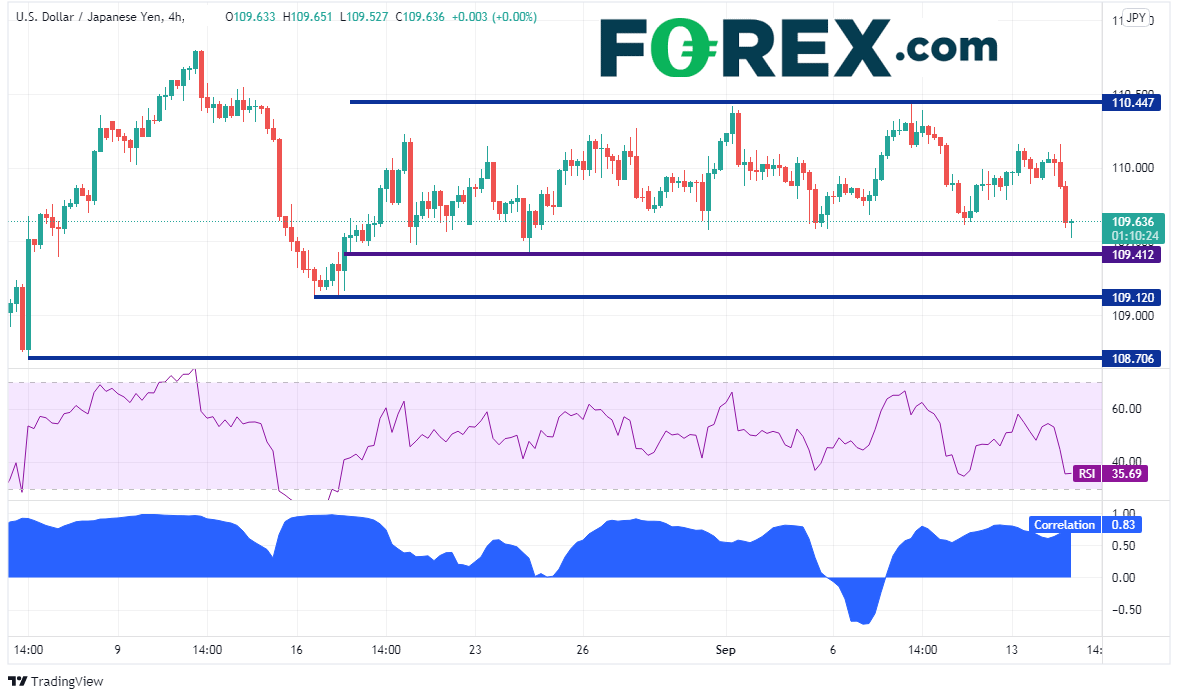
As price approaches the converging trendlines at the apex of a symmetrical triangle, there is typically little volatility until price breaks out. This can be said for the price action of USD/JPY on a 240-minute timeframe. For nearly 1 month (since August 18th), USD/JPY has traded between 109.41 and 110.45, a range of 104 pips. Today, as price broke lower out of the triangle on the daily timeframe, it made a run towards those lows, reaching 109.53. (Note at the time of this writing, the last candle was forming a hammer, a sign or a reversal. However, there is still nearly 1 hour and 10 minutes left in the timeframe for the candle to form). Support below is at 109.41 then the August 6th lows at 109.11. The August 6th lows are further down near 108.70. There is resistance at yesterday’s lows near 109.90, then today’s highs at 110.16. Above there, resistance is the range highs at 110.46.

Source: Tradingview, Stone X
Everything you should know about the Japanese Yen
As is often the case, USD/JPY and US 10-year yields tend to be positively correlated. The current correlation on a 240-minute timeframe is +0.83. Correlations above +0.80 and below -0.80 are the most reliable. Therefore, is US 10-year yields move in one direction, USD/JPY tends to move in the same direction.
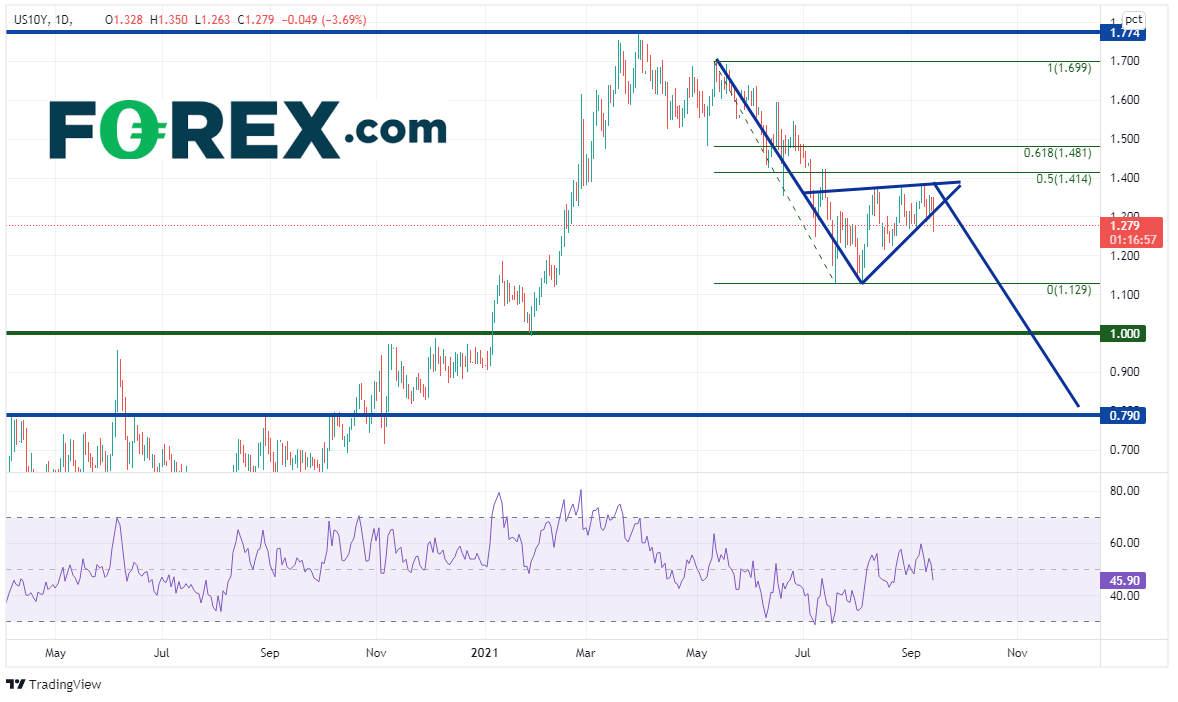
As one may expect, US 10-year yields have been trading in a similar channel as USD/JPY since August 5th, between 1.217 and 1.385. Similarly, when one looks at a daily timeframe, a similar breakdown out of a triangle can be seen. However, this triangle is a rising pennant, against the trend. The target for this triangle is the length of the “pole”, added to the breakdown point of the pennant. This projects a target near 0.81, just above horizontal support near 0.79.

Source: Tradingview, Stone X
USD/JPY and US 10-year yields are highly correlated. Both are breaking down from triangle formations, however yields look to be breaking down from more of a corrective triangle. Therefore, if yields continue moving lower over the next few weeks, USD/JPY should move with it!
Learn more about forex trading opportunities.


