The BOE left rates unchanged at 0.1% and their bond-buying program unchanged at GBP 895 billion, both as expected, at their September 2021 meeting. However, Ramsden joined Saunders as the two dissenters in favor of lowering the overall QE amount to GBP 860 billion. In addition, they noted that “some market tightening over the forecast period was likely to be necessary to be consistent with meeting the inflation target sustainably in the medium term”. With the addition of Ramsden to the tapering talk and the “market tightening” phrase thrown in, this meeting was more hawkish than expected.
Everything you need to know about the Bank of England
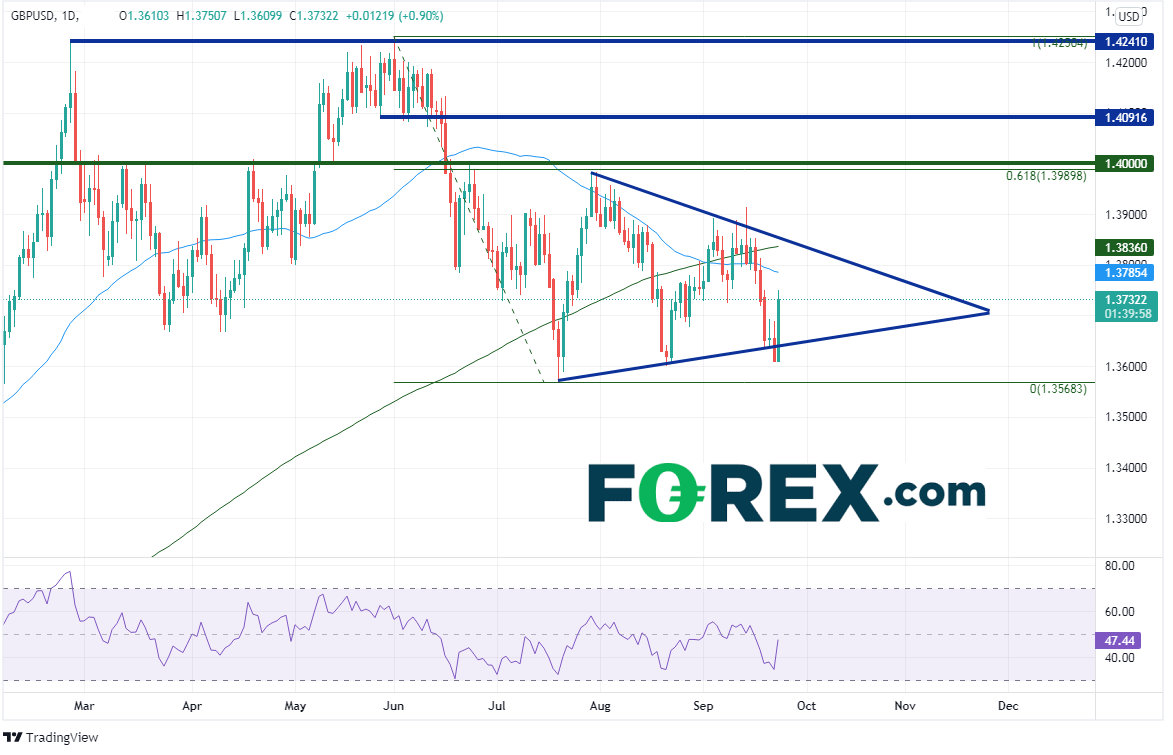
The immediate reaction for the Pound was to go bid. For the day, GBP/USD was up nearly 120 pips! However, the pair has been making lower highs since May 31st, when it reached 1.4241. The pair traded below 1.4000 on June 17th and hasn’t looked back. GBP/USD is currently in a symmetrical triangle since making a low of 1.2571 on July 20th. With the help of US Dollar buying into the FOMC meeting, the pair briefly pushed below the bottom rising trendline of the triangle to 1.3609. With the hawkish BOE and a “Buy the rumor, sell the fact” trade in the US Dollar, GBP/USD was off to the races!

Source: Tradgview, Stone X
On a 240-minute chart, GBP/USD has bounced towards the 50% retracement from the highs of September 14th to Wednesday’s lows and horizonal resistance at 1.3761/1.3764, which acts as first resistance. Above is the 50 Day Moving Average at 1.3785 and then the 61.8% Fibonacci retracement level from the same timeframe at 1.3797. There are additional levels before reaching the downward sloping longer term channel near 1.3830. Symmetrical triangles typically resolve themselves in the direction of the trend prior to the triangle. Traders should also question how much longer the DXY will selloff with the hawkish FOMC statement. In this case, traders may expect GBP/USD to move lower. If so, Wednesday’s low and horizontal support are near 1.3609/1.3605 and then additional horizontal support near 1.3572.

Source: Tradgview, Stone X
Trade GBP/USD now: Login or open a new account!
The initial reaction of EUR/GBP was to move lower as the Pound was making its run higher. The pair has been moving lower in a channel pattern since putting in near term highs at 0.8718. On Wednesday, the pair spiked through the top trendline of the channel to 0.8613, before reversing and closing the day with a shooting star formation, a one candle reversal pattern. Price did indeed move lower today, however it was halted at the first support level, the 50 Day Moving Average of 0.8544.

Source: Tradgview, Stone X
If the pair can move below the 50 Day Moving Average, the 61.8% Fibonacci retracement from the August 10th lows to the September 7th highs sits just below at 0.8513, however price did spike through that level on September 16th to 0.8500, setting up a possible double top if price breaks below. The final support before reaching the double top target of 0.8408 is the August 10th lows at 0.8450, which also confluences with the bottom trendline of the longer-term channel. If price bounces, intraday resistance is at 0.8563, ahead of Thursday’s highs at 0.8589 and then Wednesday’s test of the prior highs at 0.8614.

Source: Tradgview, Stone X
Trade EUR/GBP now: Login or open a new account!
With a more hawkish BOE today, the Pound has gone bid against many currencies. However, it will be tough to maintain its strength in some pairs. The FOMC was the most hawkish they’ve been since the pandemic began, and one must wonder whether GBP can maintain its strength against it. However, vs the Euro, the Pound appears to be making a move towards the opposite side of the channel.
Learn more about forex trading opportunities.


