Asian Indices:
- Australia's ASX 200 index rose by 44.6 points (0.6%) and currently trades at 7,461.60
- Japan's Nikkei 225 index has fallen by -253.91 points (-0.83%) and currently trades at 30,259.09
- Hong Kong's Hang Seng index has fallen by -494.39 points (-1.97%) and currently trades at 24,538.82
UK and Europe:
- UK's FTSE 100 futures are currently up 0.5 points (0.01%), the cash market is currently estimated to open at 7,016.99
- Euro STOXX 50 futures are currently up 4.5 points (0.11%), the cash market is currently estimated to open at 4,150.44
- Germany's DAX futures are currently up 8 points (0.05%), the cash market is currently estimated to open at 15,624.00
US Futures:
- DJI futures are currently up 236.82 points (0.68%)
- S&P 500 futures are currently down -9 points (-0.06%)
- Nasdaq 100 futures are currently down -3.5 points (-0.08%)
Asian indices lower, futures mixed
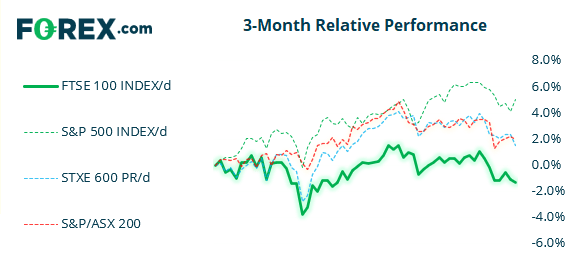
Japan’s equity markets failed to hold onto earlier gains as investors likely booked profits after an explosive bullish run. A large bearish engulfing candle formed on the Nikkei 225 after printing two Doji’s just off its February high, and failing to close to a 30-year high. Given the size of today’s candle we suspect an (arguably overdue) correction is now underway.
The Hang Seng was the weakest performer, shedding -2% and falling to its lowest level this year. Casino stocks weighed on the broader market as gaming consultations were underway ahead of casino rebidding.

The S&P 500 E-mini futures contract saw a false break below trend support this week. Price action continues to hold above the 50-day eMA and the fact the false break did not even test it show that bullish momentum is building. Also note that yesterday’s elongated bullish candle on the dour-hour chart was the most volatile candle since the one seen on the 20th August, which was just off structural lows ahead of its next rally. We are therefore bullish above the 4425 low and now seeking a break above 4483.50 to assume bullish continuation.
View today’s video: Nasdaq Holds its Ground, Alphabet Completes its ABC
FTSE 350: Market Internals

FTSE 350: 4053.58 (-0.25%) 15 September 2021
- 70 (20.00%) stocks advanced and 268 (76.57%) declined
- 5 stocks rose to a new 52-week high, 14 fell to new lows
- 66% of stocks closed above their 200-day average
- 50.86% of stocks closed above their 50-day average
- 15.43% of stocks closed above their 20-day average
Outperformers:
- + 5.4% - Tullow Oil PLC (TLW.L)
- + 3.6% - EVRAZ plc (EVRE.L)
- + 3.5% - Civitas Social Housing PLC (CSH.L)
Underperformers:
- -10.5% - Restaurant Group PLC (RTN.L)
- -6.61% - Trustpilot Group PLC (TRST.L)
- -5.75% - Beazley PLC (BEZG.L)
Forex: Stella growth report for New Zealand
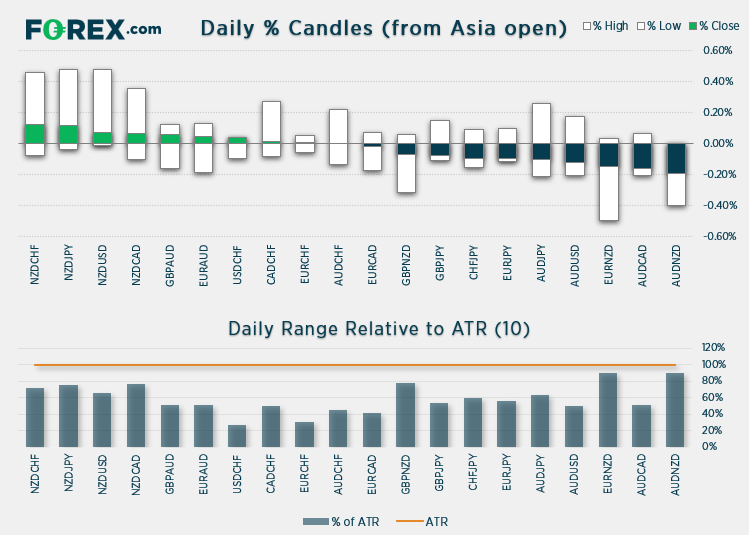
New Zealand’s GDP expanded by 17.4% in Q2, above the 16.4% expected to hit a record high. On the quarter GDP also posted a healthy 2.8% expansion which prompted some to speculate that RBNZ will now be on track to hike at their next meeting. However, as GDP is backwards looking and this data set does not include the negative impact of recent lockdowns, it remains uncertain as to whether RBNZ will actually hike. We think it would be shrewd to wait for any such confirmation from RBNZ during public addresses over the coming week/s to see if a hike garners any merit.
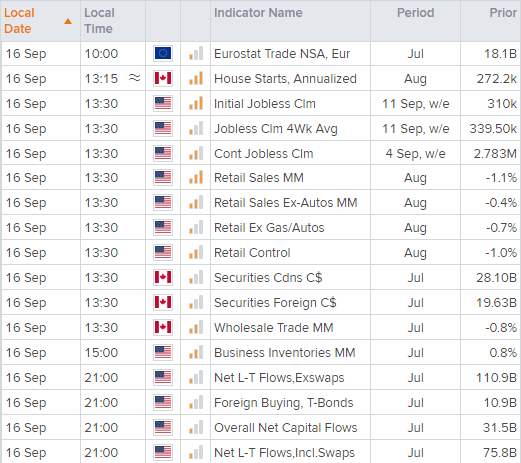
A host of US data released at 13:30 BST includes employment data, business sentiment and retail sales. With employment claims sitting at post-pandemic lows following softer-than-expected-inflation, a surprise uptick of claims could spook dollar bulls further. Couple that with dire retail sales and we could have a bearish session for US on our hands (in which case gold, silver and copper might gain some bullish attention). Essentially any data between now and up to next week’s FOMC meeting could leave the US dollar vulnerable to pockets of volatility.
Learn how to trade forex
Commodities break broadly higher
The CRB commodity index broke to a 6-year high yesterday, after breaking out of the flag pattern the daily chart mentioned in yesterday’s video. Our bias remains bullish above 216.85 and its next target is the 227.47 high.
WTI also broke higher and trades around 72.80. Should oil prices continue higher it could provide further support for Wall Street (as it did yesterday) and help the S&P E-minis contract break above resistance.
Up Next (Times in BST)


