Earlier today, the EU released its Flash CPI data for August. The YoY print was 3% vs 2.7% expected and 2.2% in July. This is the highest reading in nearly 10 years! Just as with much of the rest of the developed world, rising inflation stemmed from strong demand and supply chain issues as economies reopen post-Covid. A rise in energy prices was the main culprit for the increase in inflation. The Core CPI was 1.6% vs 1.5% expected, more than double the 0.7% in July.
Will hawks be looking to change the pace of bond bonding under the Pandemic Emergency Purchase Program (PEPP) come the ECB meeting next week? Last week, VP de Guindos suggested that forecasts could be revised upward. He also added that fiscal and monetary policy should be normalized as well, as the economy recovers. Today, after the CPI print, both Holzman and Knot commented that PEPP could be slowed in Q4. Knot went as far as saying, “Euro Area inflation may justify end to ECB crisis mode.” However, Chief Economist Lane said that there was no hurry to remove favorable financing conditions and should wait to adjust PEPP. ECB’s Villeroy also added this week that although the ECB should take account of a recent improvement in financing conditions, they can adjust bond purchases as needed each month under PEPP because they are not tied into buying any specific amount per month. PEPP is currently set to expire in March 2022.
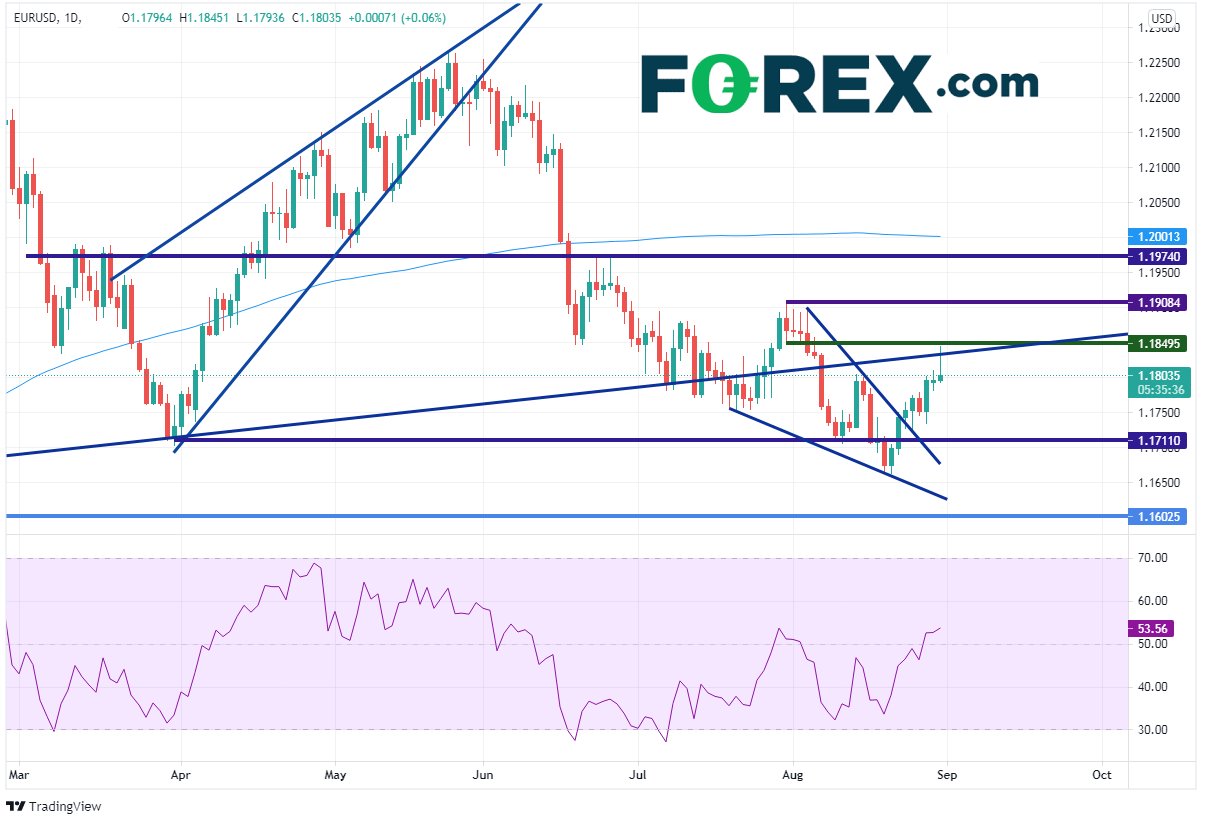
EUR/USD had broken out of a descending wedge on August 24th and began moving higher. However today, the pair ran into resistance on the daily timeframe at a longer-term upward sloping trendline and horizontal resistance. Although the day isn’t over yet. If today’s candlestick closed near 1.1800, it would form a shooting start, an indication that the pair may be ready to continue its move lower.

Source: Tradingview, StoneX
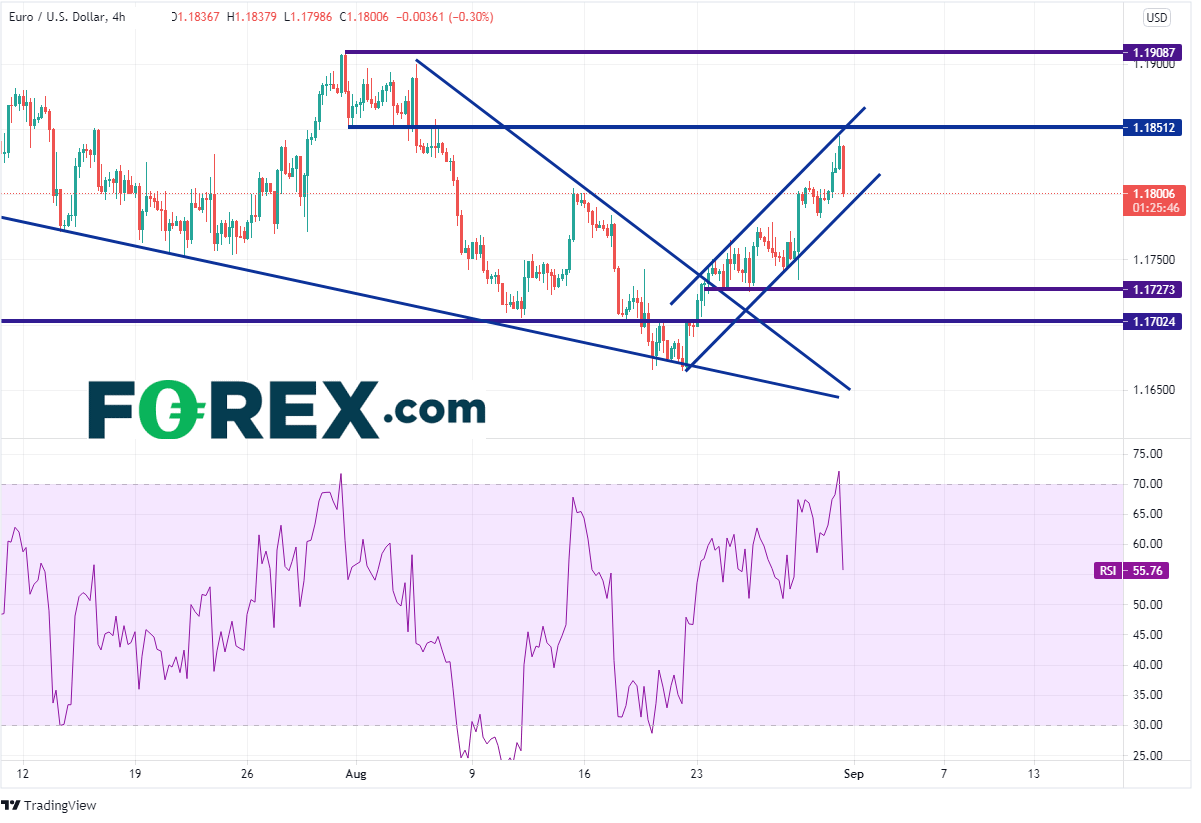
On a 240-minute timeframe, the EUR/USD had been moving higher in an orderly fashion once it broke out of the descending triangle. In addition to the resistance mentioned above, the pair also hit the top of the upward sloping channel. First resistance is near todays highs, the top trendline of the channel, and horizontal resistance, near 1.1850. Above there, price can run to the next resistance level at 1.1908. Support is at the bottom trendline of the channel near 1.1780. Below there is horizontal support near 1.1725 and again near 1.1700.

Source: Tradingview, StoneX
The EU CPI was much higher for August than it was in July. Already today, the hawks are coming out as both Holzman and Knot have suggested pulling back the amount purchases under PEPP. But the big question is “Will they have influence over the rest of the ECB members, as well as Lagarde?”
Learn more about forex trading opportunities.


