For an asset class that’s only a little more than a decade old, cryptoassets have already gone through a several full market cycles, allowing astute traders to draw conclusions about how the market may perform moving forward.
For instance, Bitcoin (the closest thing to a “blue chip” asset in the space) tends to outperform through crypto bear markets and has historically been the first to rally early in bull market cycles. We saw this exact dynamic play out through the 2018 bear market, with Bitcoin rallying strongly through H1 2019 and again starting in Q4 2020.
At a certain point, Bitcoin has historically “passed the torch” to major altcoins like Ethereum and Litecoin. The price action since the start of 2021 seems to reflect this shift to a middle-aged bull market in the broader cryptoasset ecosystem. Since New Year’s Day, Ethereum has more than doubled from $730 to above $1600, whereas Bitcoin has gained “only” 29% as of writing.
What’s driving ETH/USD?
Unlike the “all fluff, no substance” ICO boom that propelled ETH/USD to record highs in Q4 2017, the current rally in Ethereum is being driven by growing adoption of decentralized applications (dApps) built on the platform. In particular, decentralized finance (DeFi) applications that allow individuals to conduct financial transactions without traditional finance intermediaries are seeing rapid adoption. According to DeFiPulse, the US dollar value locked in DeFi applications sits at $35B, roughly triple what it was at the start of December. In other words, ETH/USD is rising because the entire Ethereum network is more useful than it’s ever been before.
ETH/USD technical analysis
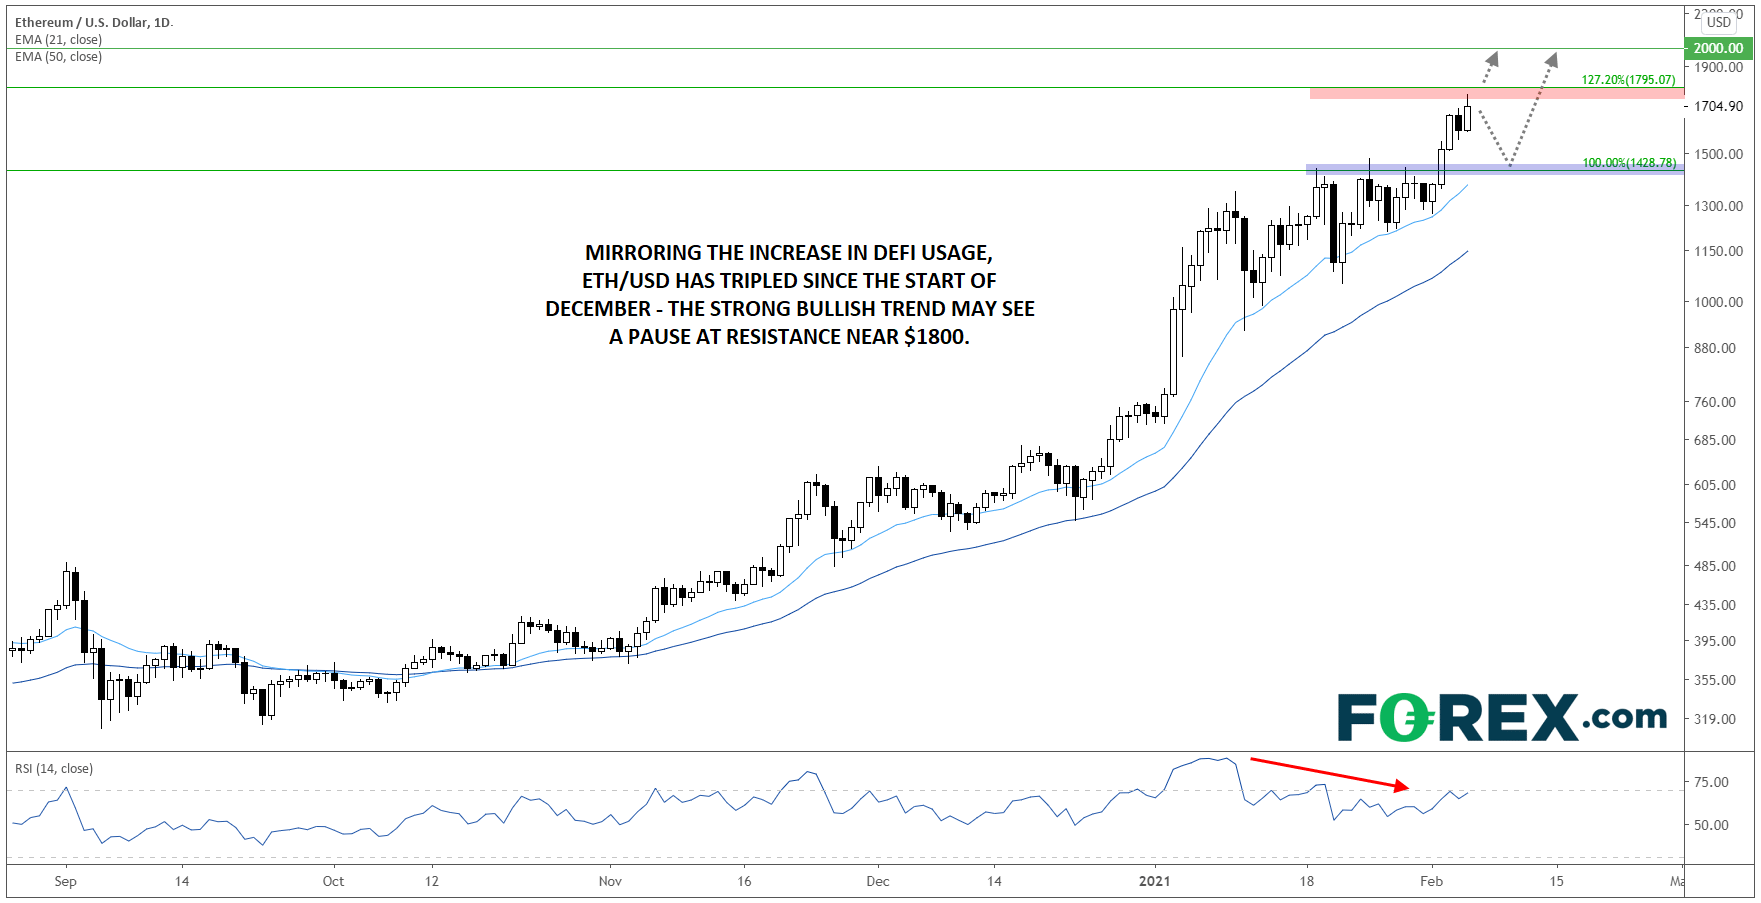
Not surprisingly, the tripling in the amount invested in DeFi since the start of December has been almost perfectly reflected in a tripling in the price of Ethereum over that same period. As we go to press, ETH/USD is testing the 127% Fibonacci extension of the 2018 collapse near $1800. At the same time, the daily RSI indicator is showing a bearish divergence, signaling that buying pressure may be waning as prices approach resistance:

Source: TradingView, GAIN Capital
If price stalls out near $1800, we could see a short-term pullback toward previous-resistance-turned-support and the rising 21-day EMA in the mid-$1400s.
That said, with fundamental adoption growing rapidly, traders are likely to buy up any near-term dips in ETH/USD, so traders shouldn’t be surprised if the price of this exciting new asset reaches $2000 or higher in the coming weeks.


