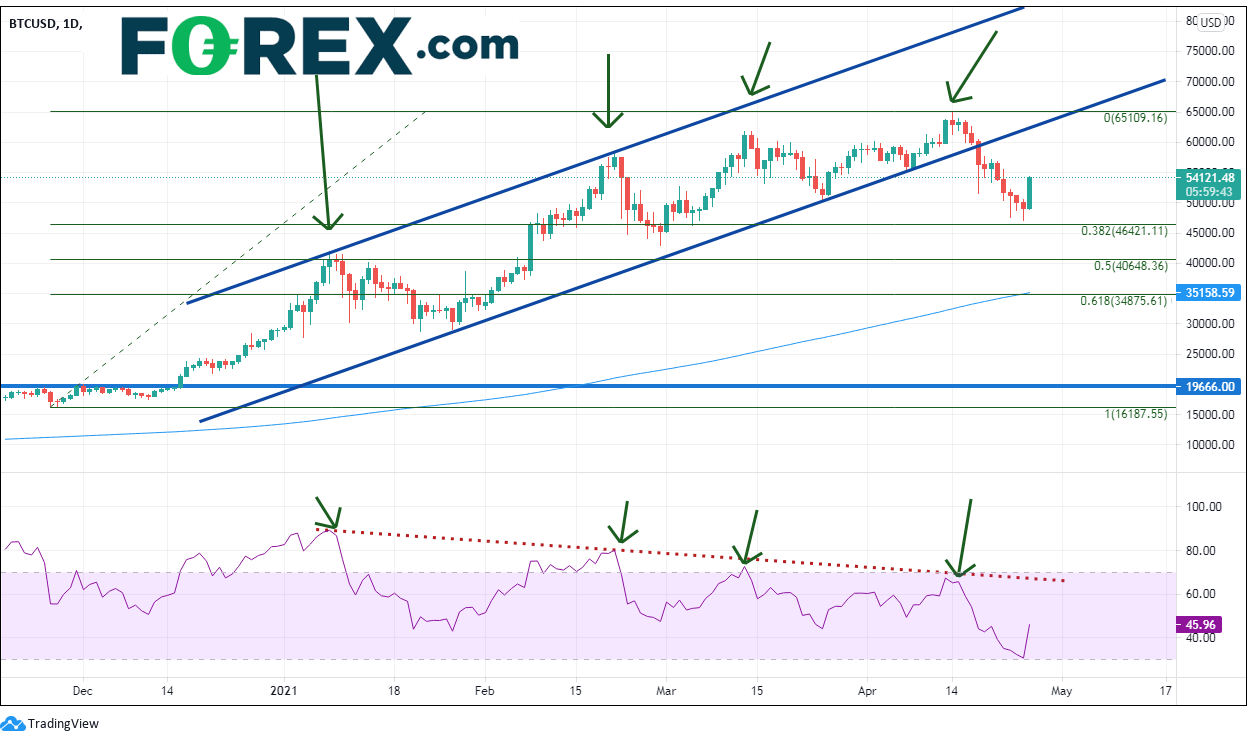
On April 18th, Bitcoin (BTC) moved from a high of 60,048.82 down to 51,541.16. A move from high to low of just over 14%. Before that, BTC had been in an upward sloping channel since late November 2020. Price moved from a low of 16,218 on November 26th, 200 to a high of 64,895.22 on April 14th, in an upward sloping orderly channel. The move lower off the highs had been telegraphed well in advance of the move. Price had been putting in higher highs and the RSI had been putting in lower highs since January. It was just a matter of timing. The move lower below the channel appears to have been a stop run and take profit orders were triggered on the break of the channel.

Source: Tradingview, FOREX.com
Price continued lower to the 38.2% Fibonacci retracement level from the November lows to the April highs this past weekend, near 46,321.11.
On Saturday, Elon Musk tweeted this inconspicuous note, which led some to believe is the reason for today’s buying:

Source: Twitter
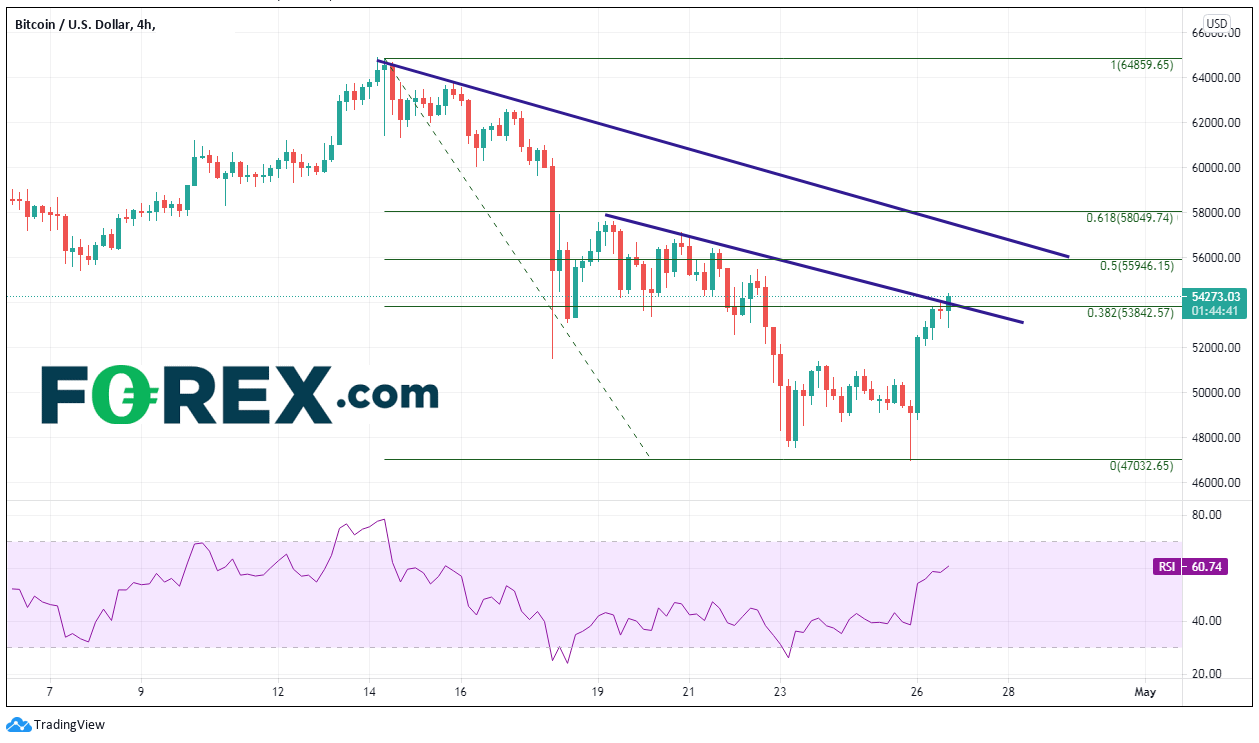
Regardless of the reason, BTC is bid today. On the 240-minute timeframe, price has bounced to the 38.2% Fibonacci retracement from the April 14th highs to today’s lows, near 53,852.57, which is over 10% higher on the day. Price also confluences with the downward sloping trendline from April 19th near that level. Next resistance is at the 50% retracement level, which confluences with another downward sloping trendline near 55,946.15.

Source: Tradingview, FOREX.com
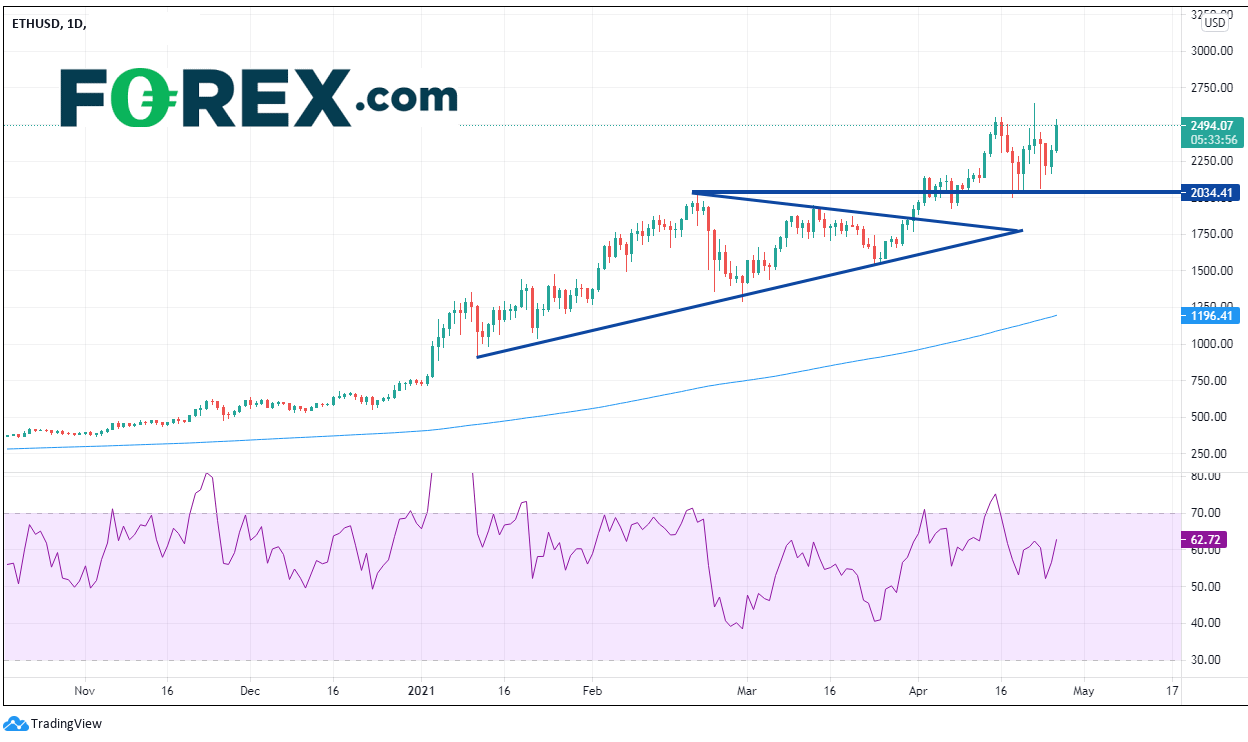
On the other side of the coin is Ethereum (ETH). The crypto currency has been moving higher over the same timeframe, at a more aggressive pace, but from a much lower price level. On November 26th, 2020 the low was 480.08. Since then, price moved higher to 2,646.20 on April 22nd. After a pullback on April 23rd of 22%(!) to 2060 (which was previous highs from February 20th), ETH began moving higher once again and appears ready to test the April 22nd highs, currently trading near 2493.50 as of the time of this writing.

Source: Tradingview, FOREX.com
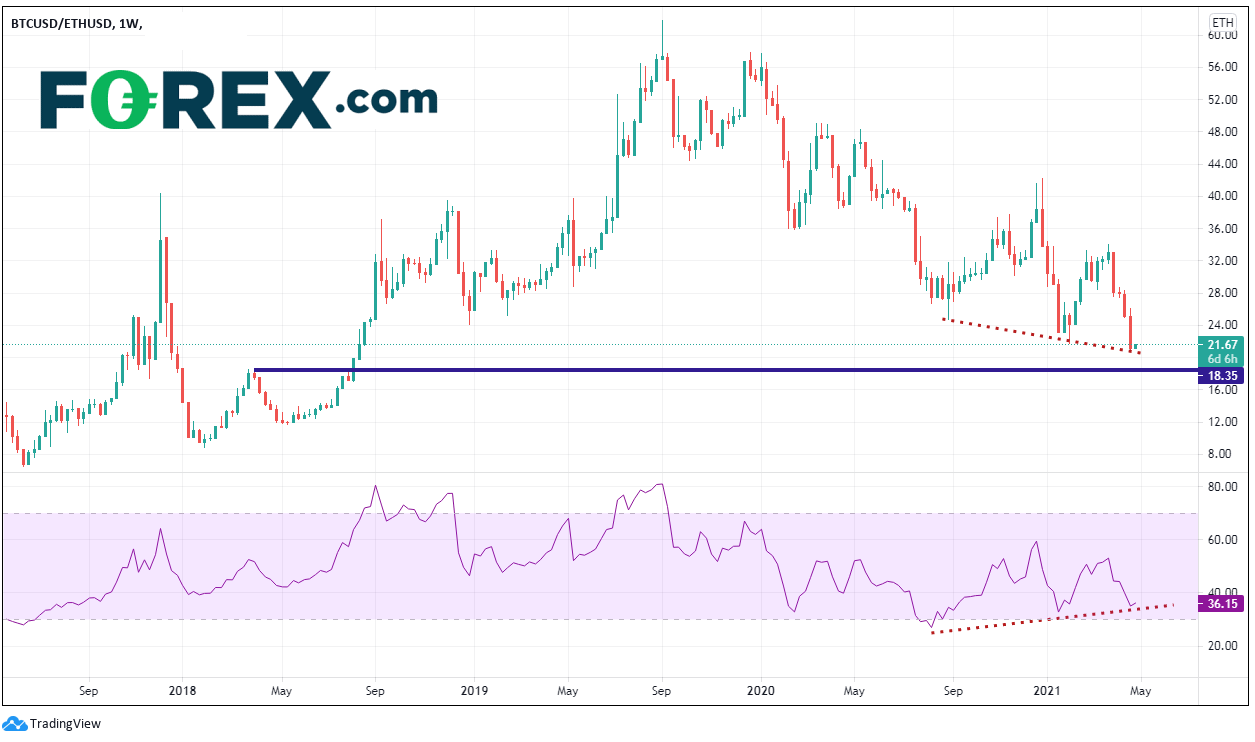
Now look at the weekly BTC/ETH ratio. The ratio has been moving lower since putting in highs near 61.84 and a weekly shooting star during the week of September 2nd, 2019. Since then, the ratio has moved lower. Last week, it took out the February 1st weekly lows near 21.74. Over the last 4 weeks, with the pullback in BTC, the BTC/ETH ratio moved from 33.07 down to 21.74, nearly 34%! Next level of support is horizontal support at the April 2018 highs, near 18.35. However, notice that price is diverging with the RSI, an indication that the ratio may be ready for a bounce.

Source: Tradingview, FOREX.com
Since September 2019, Ethereum has provided a better percentage return than Bitcoin. However, take note that the BTC/ETH ratio has fallen to near support and that the RSI is diverging from the ratio. If the ratio support holds, watch for a bounce and possibly even a change in the longer-term trend!
Learn more about cryptoasset trading opportunities.


