The economic calendar’s highly anticipated event, the Federal Reserve’s rate decision and outlook, is looming on the horizon with markets pricing in potential contractionary effects. Consumer sentiment statistics reported a drop yesterday from the 103 level towards 97, highlighting a drop in overall financial confidence.
With bearish anticipations on the horizon, the demand outlook on WTI Crude Oil is in question, weighing down on oil prices. Another factor in the play is the crude oil inventory data later today, with higher expectations for supply levels between last week’s -6.4M change and this week’s -2.3M change.
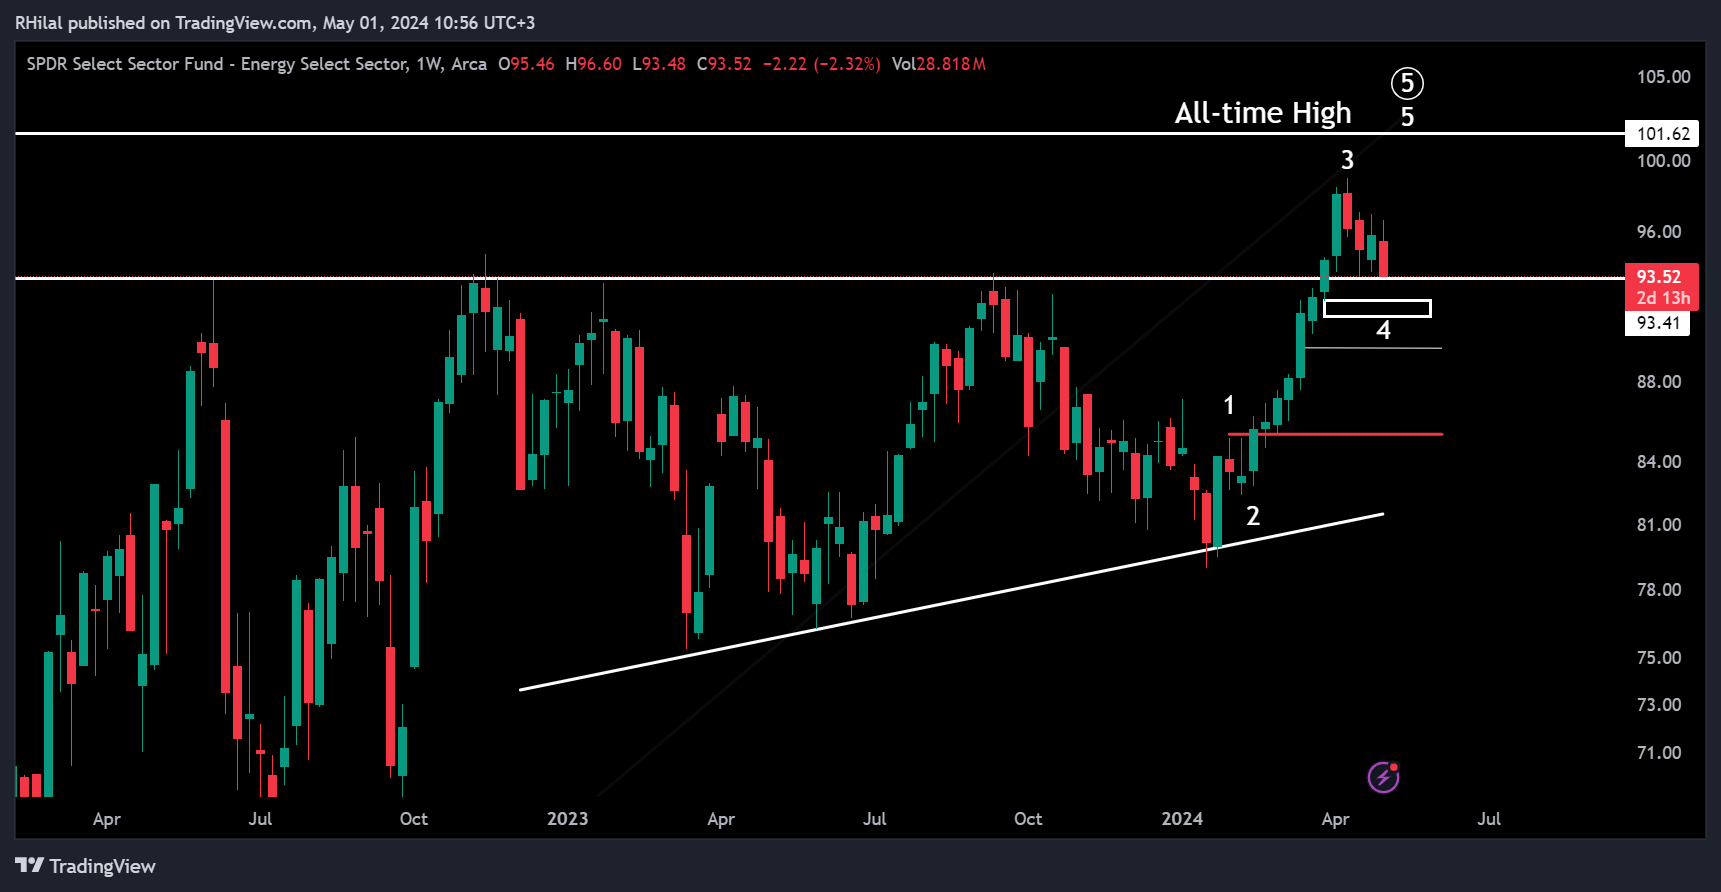
SPDR Energy Select Sector (XLE) – Weekly Timeframe – Logarithmic Scale

The Energy Select Sector ETF (XLE) is back at a significant support zone, that served as a 1.3-year resistance prior to this year’s breakout. A drop back in the extended consolidation can stimulate bearish sentiment from a pattern perspective. However, from an Elliott wave perspective, prices can still potentially hold near the previous wave’s 4 zone, between 92.20 and 92.60, prior to the continuation of the year’s trend back up to the chart’s all-time high.
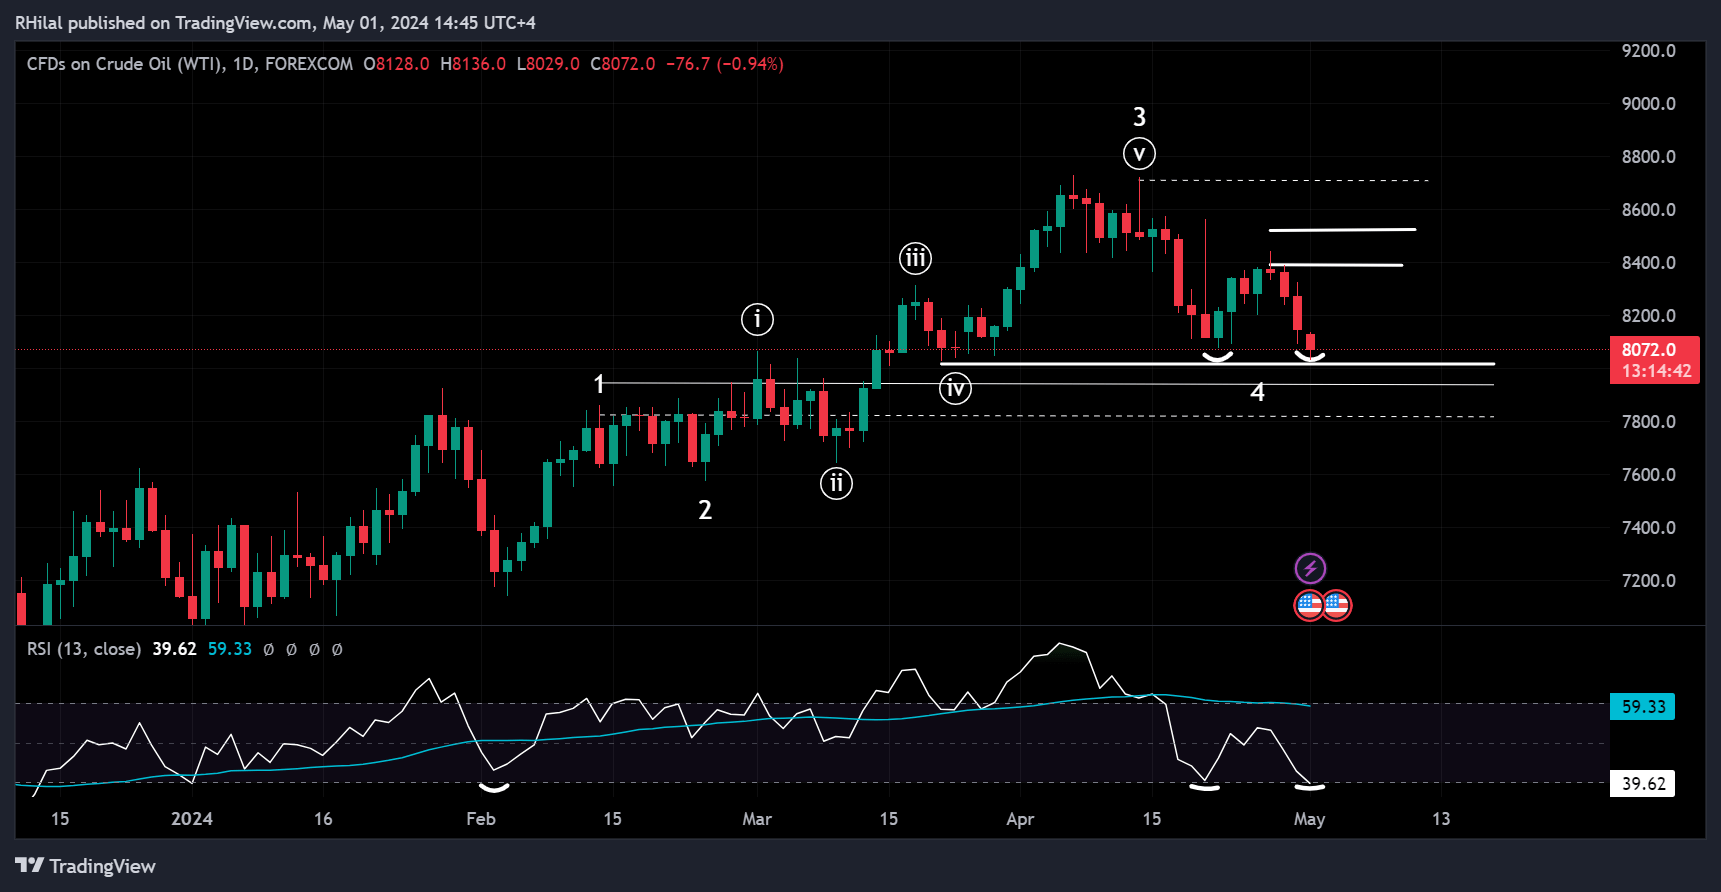
WTI Crude Oil – Daily Time Frame – Logarithmic Scale

Tracing a positive correlation with the SPDR Energy Select ETF (XLE), WTI Crude Oil touched back down the 80 zone with the latest 80.29 low. From an Elliott wave perspective, it retested near the lower degree wave 4 and can potentially hold a support level prior to the continuation of this year’s uptrend, given supporting fundamentals from positive economic outlooks and decreasing supply levels. The break below the 80-price zone can pave the way to the next significant Elliott wave level, the high of the trend’s wave 1, near the 78.60 zone. From a relative strength index perspective, the chart’s momentum dropped to weaker/oversold territories, potentially signaling an upcoming reversal.
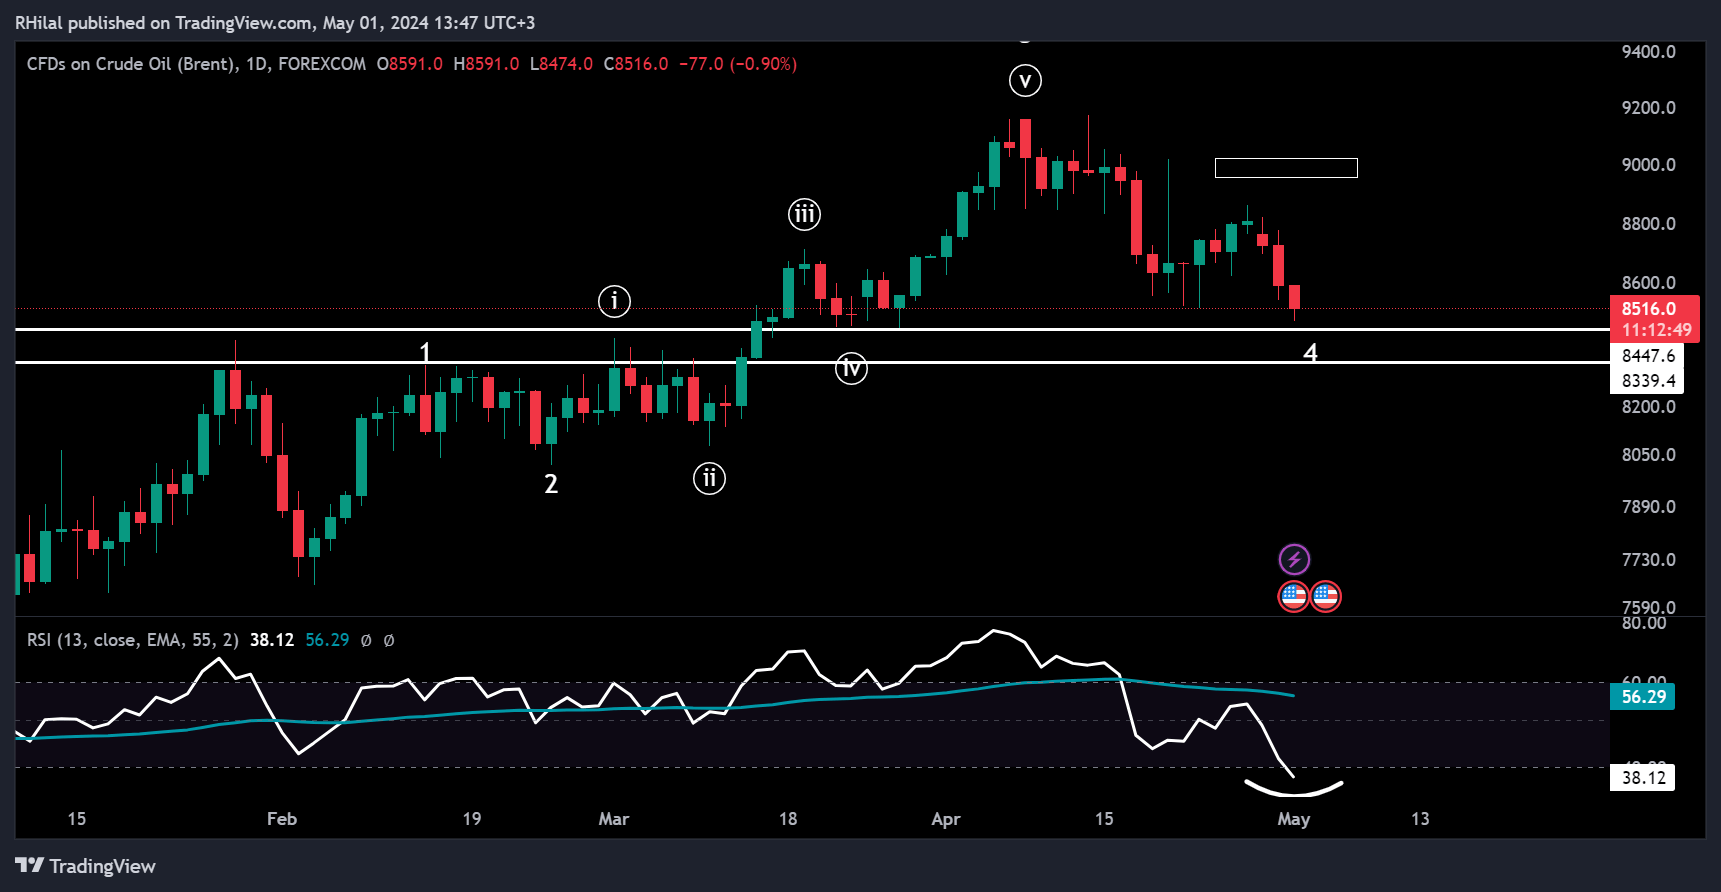
UKOIL – Daily Time Frame – Logarithmic Scale

UKOIL, also tracing positive correlations with the previously mentioned charts, tested a significant 84.74 low. A deeper correction can trace towards the trend’s wave 1 highs, near the 83.30-82.60 zone. From a relative strength index perspective, the chart’s momentum dropped to weaker/oversold territories, potentially signaling an upcoming reversal.
With technical scenarios set up, market sentiment and priced-in policies are closely monitored, anticipating heightened volatility as the day progresses.


