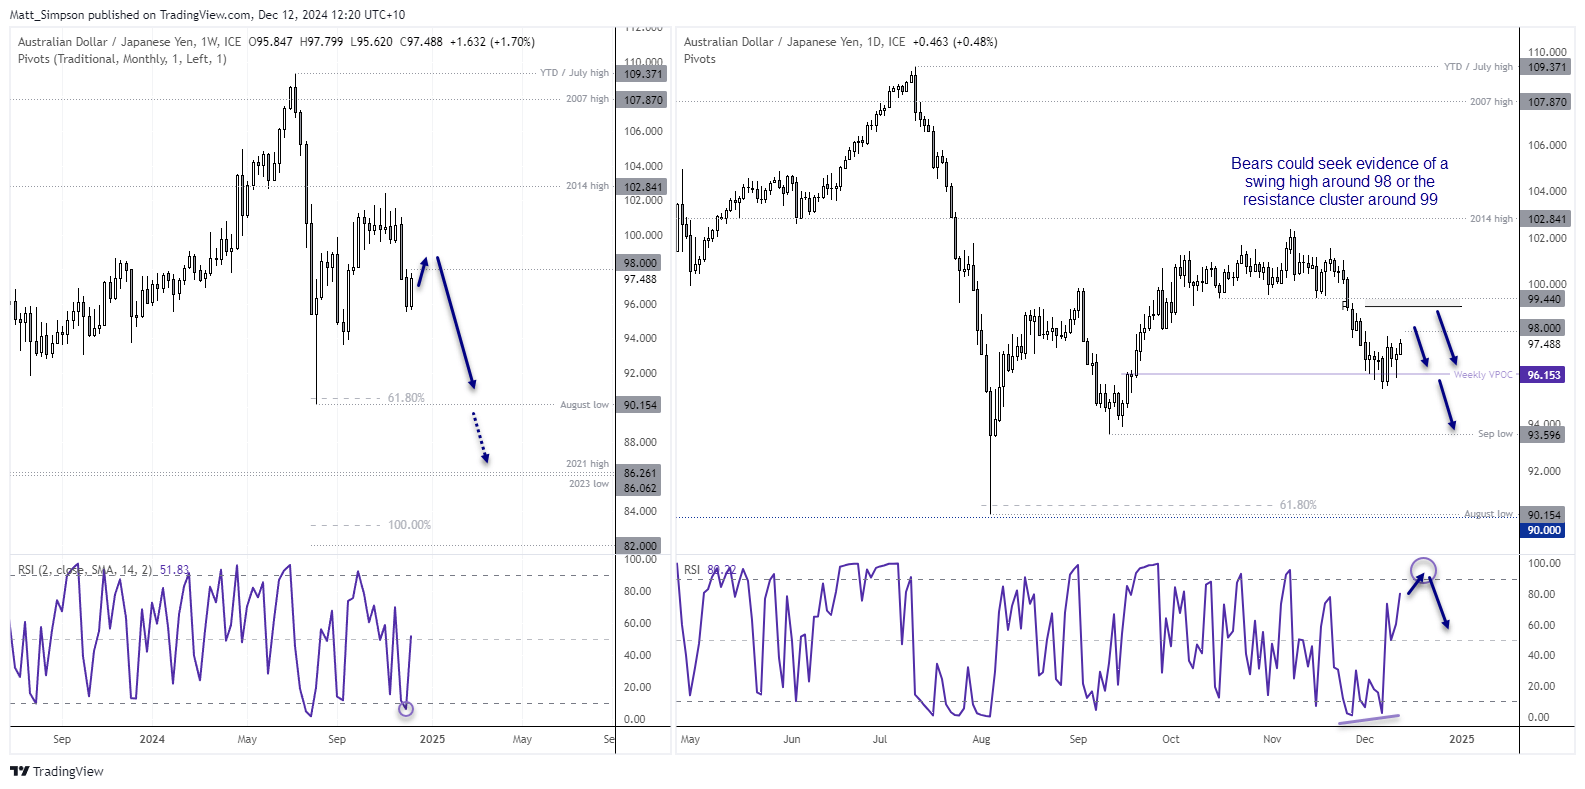
I outlined a bearish case for AUD/JPY on the 27th November, suggesting prices could at least be headed back towards the August low just above the 90 handle. Or even as low as 83. Momentum has turned lower after a 3-wave rally stalled beneath the 2014 high, putting momentum back in line with the sharp drop from the July high.
View previous analysis: 2025 could be one heck of a ride if bearish AUD/JPY clues are correct
However, the weekly RSI (2) reached oversold last week, and a base is forming around a weekly VPOC (volume point of control) which points to some bullish mean reversion over the near term. Regardless, I suspect this rally could peter out around 98, but bears also have the 99 handle, monthly pivot point (99.075) and 99.44 lows to consider fading into should any expected bounce be punchier than anticipated. Ultimately, my preference is to seek evidence of a swing high and rejoin the bearish move towards 90.

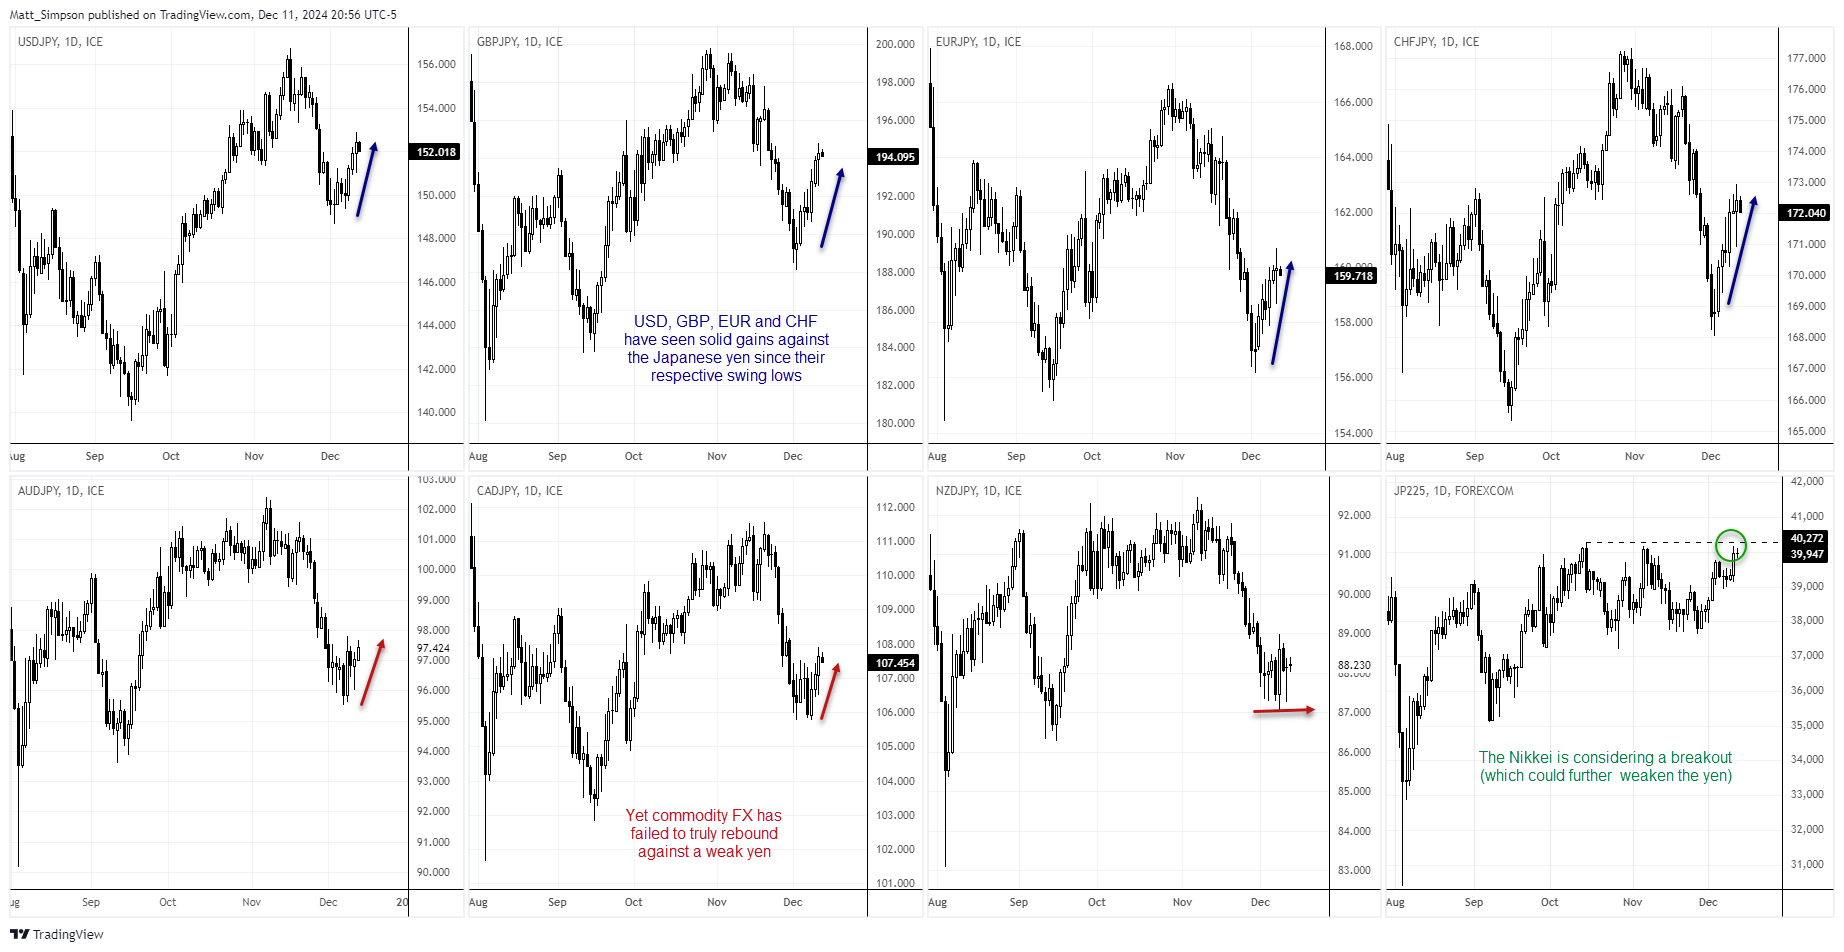
Performance against the yen has been mixed
While the yen has been broadly weaker recently, gains against it have not been even. In order of percentage returns, GBP/JPY, EUR/JPY, CHF/JPY and USD/JPY have enjoyed the best gains since their respective swing lows. Yet commodity FX have failed to make much ground, with AUD/JPY grinding its way to a 2-day high and NZD/JPY effectively moving sideways. And it took a less-dovish-than-expected 50bp cut from the BOC for CAD/JPY to hit an 8-day high on Wednesday.
Considering that US indices are at or near their record highs, I would have expected more of a bounce from commodity FX. And the fact they haven’t leaves the susceptible for further selling should appetite for risk get knocked.

Still, with the Nikkei considering a breakout (a market that tends to move inversely with its currency) then it could pave the way for further gains on yen crosses over the near term. But given the underperformance of AUD/JPY, I still have my eyes on the bearish prize for much lower prices.
USDJPY Q4
AUD/JPY technical analysis
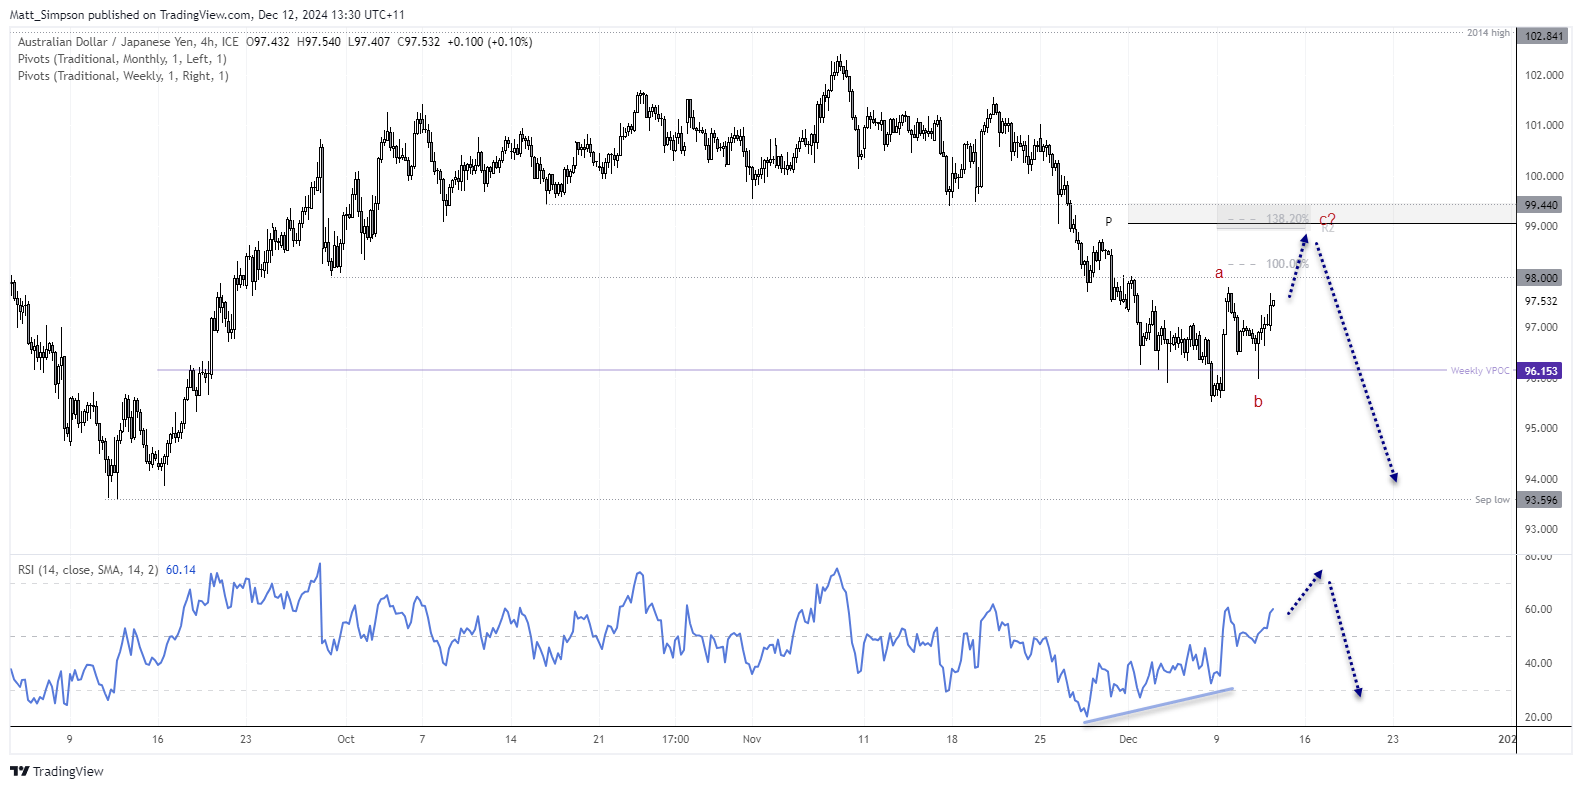
For now, AUD/JPY looks like it wants to pop higher on the 4-hour chart. A bullish RSI divergence formed ahead of the swing low, which has been followed by a higher low at the weekly VPOC with a bullish pinbar. The RSI is now confirming the small rally higher without hitting the overbought zone. I am presuming this is an ABC correction against the bearish move, which could see prices reach the 100% projection (98.23) or 138.2% (99.14) near the weekly pivot point (99.06) and weekly R2 pivot (98.96).

How to trade with FOREX.com
Follow these easy steps to start trading with FOREX.com today:
- Open a Forex.com account, or log in if you’re already a customer.
- Search for the pair you want to trade in our award-winning platform.
- Choose your position and size, and your stop and limit levels.
- Place the trade.


