Those heightened tensions between the U.S. and China give no signs of softening in the near future.
In response to China imposing a controversial national security law on Hong Kong, U.S. President Donald Trump announced on Friday that his government will end Hong Kong's preferential trade status.
Trump also said sanctions would be imposed on Chinese and Hong Kong officials involved in eroding the city's autonomy.
Then, on Monday China reportedly ordered state-owned agencies to halt purchases of U.S. agriculture products putting the first phase trade deal with the U.S. in jeopardy.
While further exchanges of actions and rhetoric between the two biggest economies in the world are expected, the U.S. dollar is weakening against the Chinese yuan.
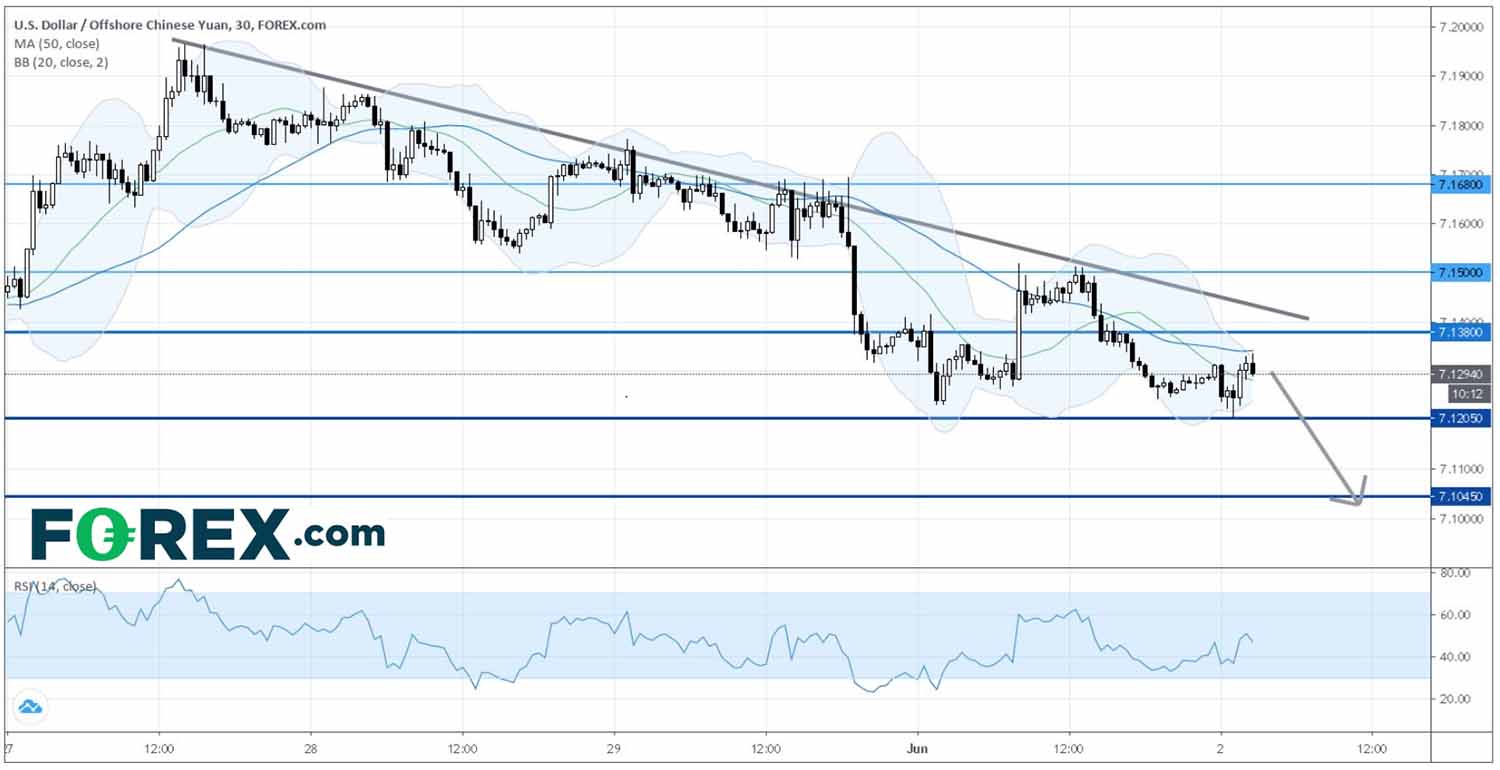
On an Intraday 30-minute Chart, USD/CNH (CNH means Chinese Yuan in the offshore market) marked on May 27 a recent high of 7.1964, which was last seen in September 2019.

Source: GAIN Capital, TradingView
In fact, the declining trend line drawn from that high on May 27 remains intact.
A return to the Immediate Support at 7.1205 (a low seen this morning) would expose the Next Support at 7.1045 (a key support level seen in May).
Only a clear break above the Overhead Key Resistance at 7.1380 would bring about a bullish reversal for the greenback against the yuan.
In response to China imposing a controversial national security law on Hong Kong, U.S. President Donald Trump announced on Friday that his government will end Hong Kong's preferential trade status.
Trump also said sanctions would be imposed on Chinese and Hong Kong officials involved in eroding the city's autonomy.
Then, on Monday China reportedly ordered state-owned agencies to halt purchases of U.S. agriculture products putting the first phase trade deal with the U.S. in jeopardy.
While further exchanges of actions and rhetoric between the two biggest economies in the world are expected, the U.S. dollar is weakening against the Chinese yuan.
On an Intraday 30-minute Chart, USD/CNH (CNH means Chinese Yuan in the offshore market) marked on May 27 a recent high of 7.1964, which was last seen in September 2019.

Source: GAIN Capital, TradingView
In fact, the declining trend line drawn from that high on May 27 remains intact.
A return to the Immediate Support at 7.1205 (a low seen this morning) would expose the Next Support at 7.1045 (a key support level seen in May).
Only a clear break above the Overhead Key Resistance at 7.1380 would bring about a bullish reversal for the greenback against the yuan.
Latest market news
Today 09:59 AM
Today 12:31 AM
Yesterday 10:31 PM
Yesterday 08:30 PM


